The noise immunity is an important characteristic in the evaluation of a touch sensing system.
The standard IEC61000-4-6 details the test environment for the conducted noise.
IEC61000-4-6 standard
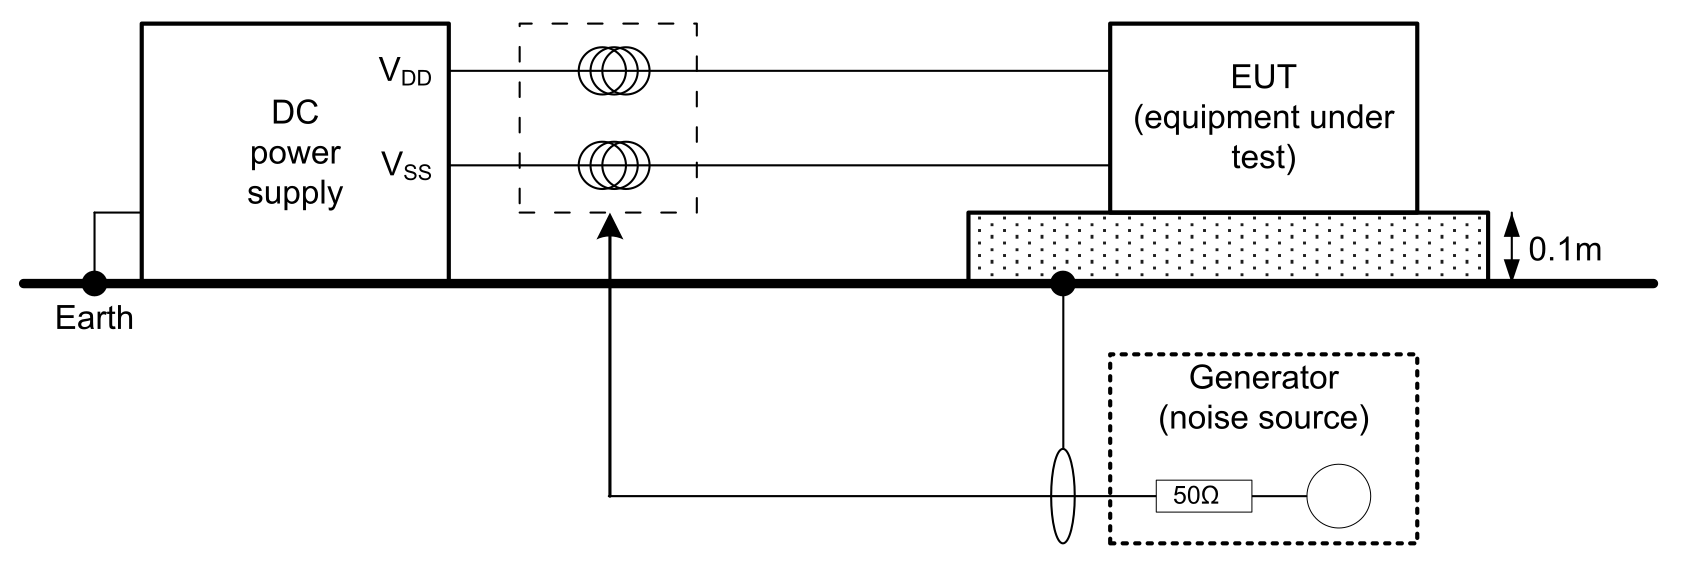
The IEC61000-4-6 standard specifies the test procedure to evaluate the conducted noise immunity of an EUT (equipment under test).
Standard IEC61000-4-6 test setup
The figure below shows how the modulated noise signals are injected into the equipment under test.Figure 1. Standard IEC61000-4-6 test setup
Touch sensing systems are based on capacitor variation measurements. The system must be able to detect capacitive variations as low as few picofarads on the sensor electrodes. Therefore, such systems may be sensitive to conducted noise.
In the test setup shown in Figure 1 Standard IEC61000-4-6 test setup, the injected signal simulates the noise perturbations to which a system may be exposed. By varying the frequency and the level of the injected signal, the test setup allows the characterization of situations where the touch system becomes unreliable.
Injected signal characteristics
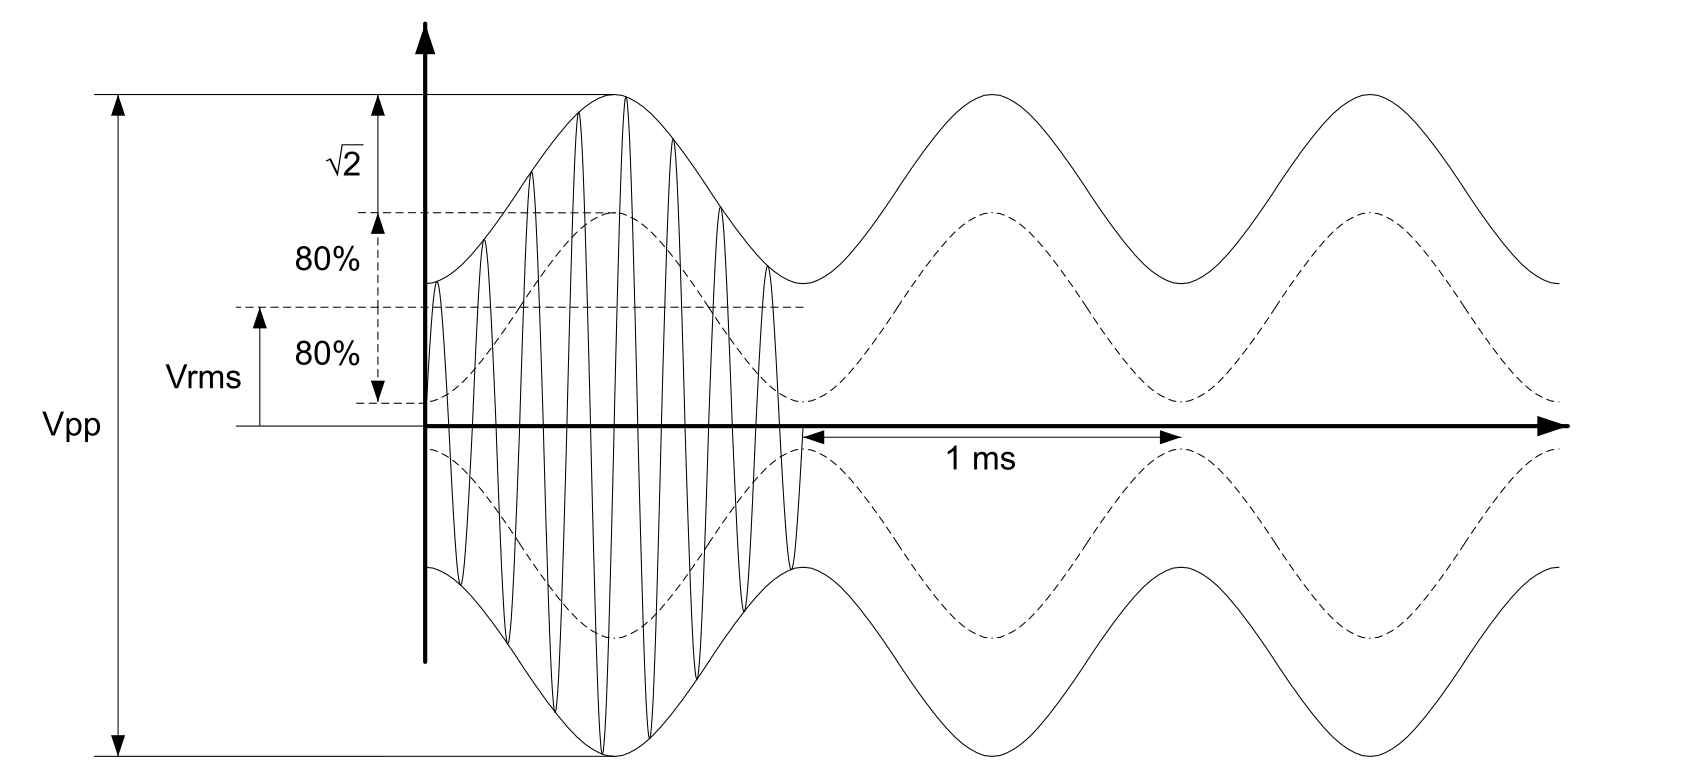
The injected signal is a swept modulated noise source with a sine wave envelope as shown in the figure below.
Figure 2. Injected signal
The noise generator frequency range is swept from 150 kHz to 80 MHz. The frequency is swept incrementally. The step size must not exceed 1 % of the preceding frequency value. The signal is 80 % amplitude modulated with a 1 kHz sine wave.
The modulated noise signal amplitude may be expressed either in Vrms or Vpp.
Here is the formula to convert values from Vrms to Vpp:
Noise immunity evaluation
The EUT noise immunity is evaluated by testing the ability of the EUT to behave according to the definition of a given class when it is submitted to a given noise level. The table below summarizes the different noise levels and classes.
Table 2. Test levels
Standard class \ noise level
Level 1
1 Vrms
Level 2
3 Vrms
Level 3
10 Vrms
Class A: system works normally.
Pass/fail
Pass/fail
Pass/fail
Class B: Some degradation in operation may occur (false touch detection or touch masking), but the product recovers once the stress is removed without any operator intervention.
Pass/fail
Pass/fail
Pass/fail
Class C: same as class B but needs an external action (such as reset or power off/on) to return to normal state.
Pass/fail
Pass/fail
Pass/fail
Class D: system loosing function or degradation of performance that is not recoverable
Pass/fail
Pass/fail
Pass/fail
IEC61000-4-6 standard limitation
The minimum frequency step recommended by the standard to sweep the injected signal from 150 kHz to 80 MHz is 1 % of the preceding frequency value. At 500 kHz this represents a 5 kHz step.
On most touch sensing systems, these steps are too large to be able to isolate the worst case situations. Some applications with narrow critical wave band can pass 3 Vrms if the critical frequency falls just in the middle between tested frequencies. The same application does not pass 1 Vrms if the user sets the test exactly on the critical frequency.
It is then important to set smaller steps around the critical frequencies. Sometime the standard bench is not able to do the appropriate step (for example 100 Hz). Test set up proposal to detect worst case proposes a method to detect the worst case.
Surface charge transfer acquisition principle overview
The STM32 microcontrollers use a surface charge transfer acquisition principle, briefly described below.
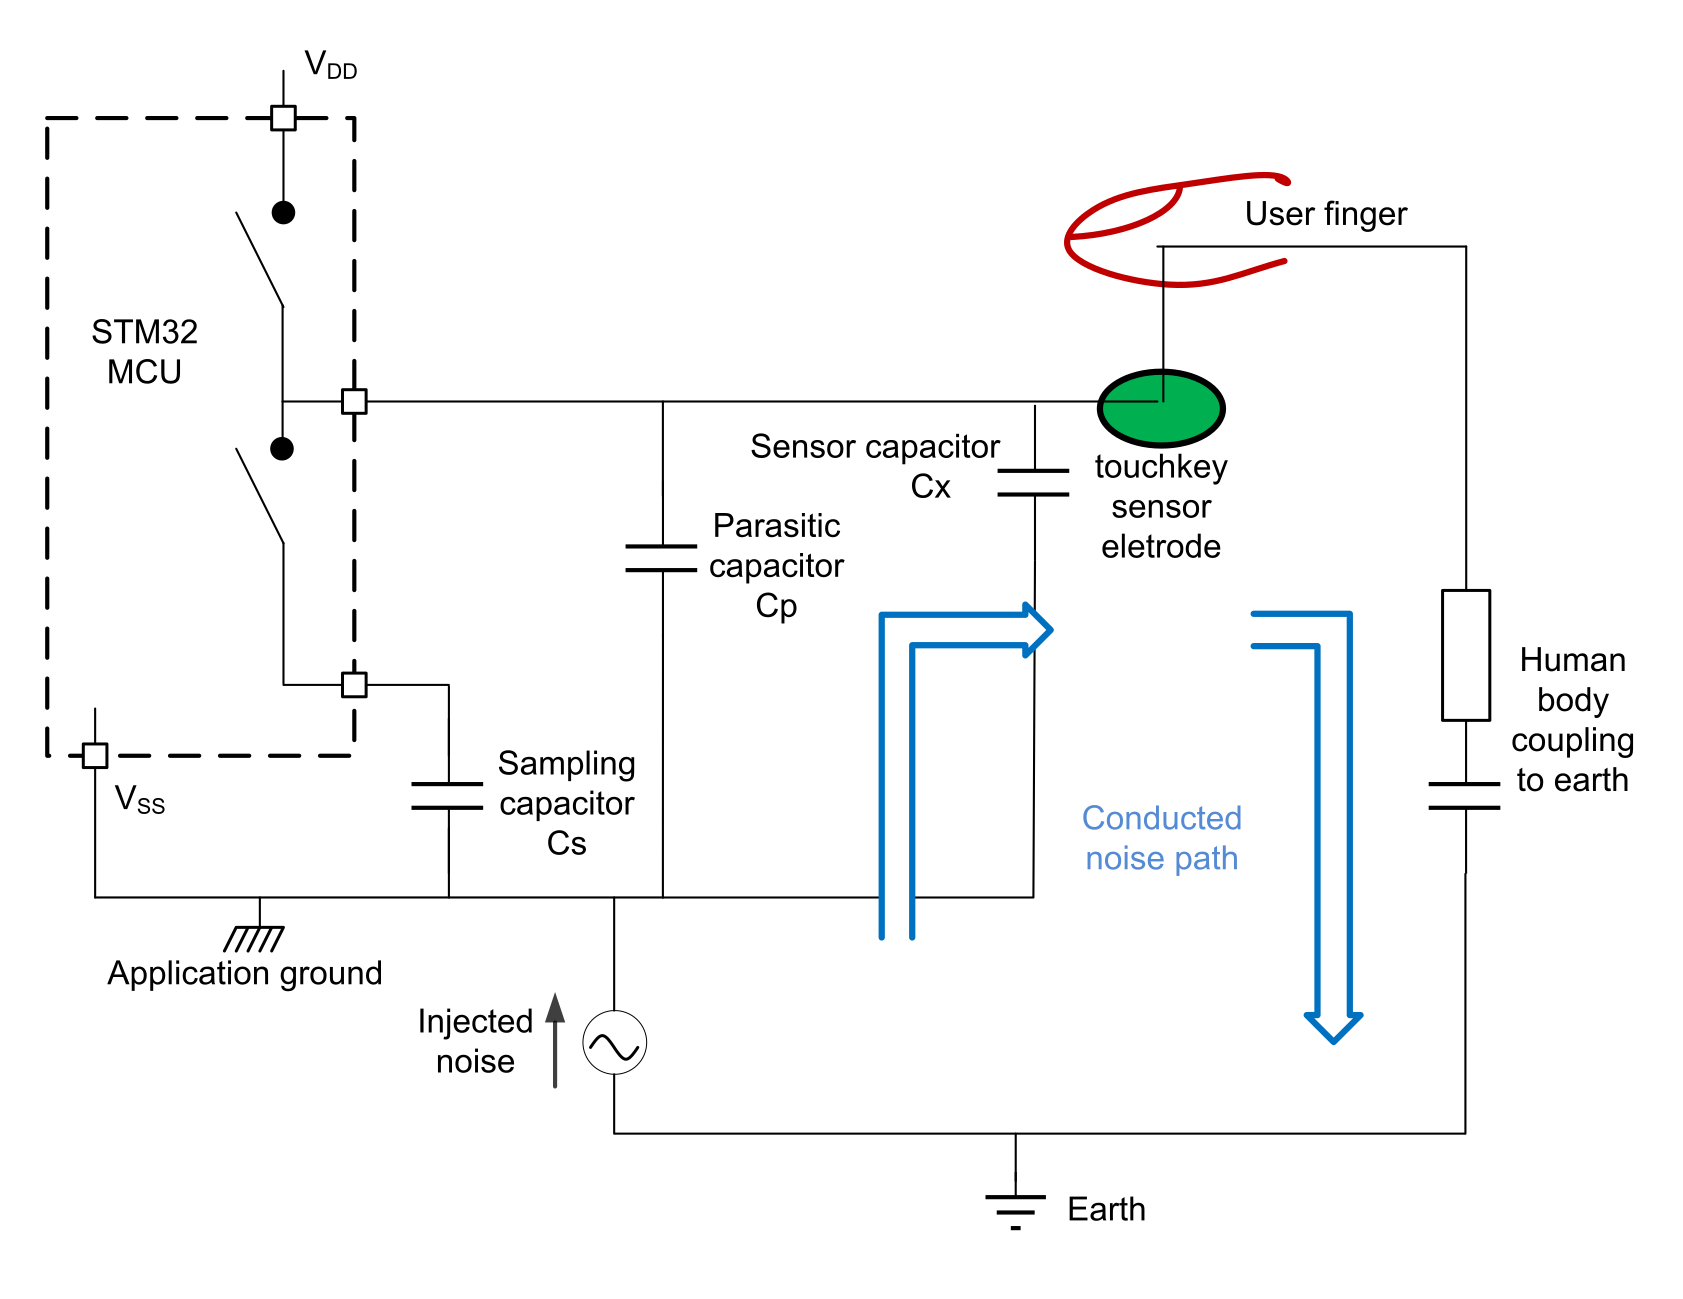
The surface charge transfer acquisition principle consists in charging a sensor capacitance (Cx) and transferring a part of the accumulated charge into a sampling capacitor (Cs). This sequence is repeated until the voltage across Cs reaches a given threshold (VIH in our case). The number of charge transfers required to reach the threshold is a direct representation of the size of the electrode capacitance.
When the sensor is touched, the sensor capacitance to the earth is increased so the Cs voltage reaches the threshold with less count and the measurement value decreases. When the measurement value falls below a defined threshold, a detection is reported.
The noise injection disturbs the measurement proportionally to its amplitude and depending on its frequency. The worst case is generally found at a noise frequency close to the charge transfer frequency (assuming no techniques are used to spread this frequency).Figure 3. Charge transfer equivalent capacitance model
Sampling capacitor (Cs) voltage level without noise
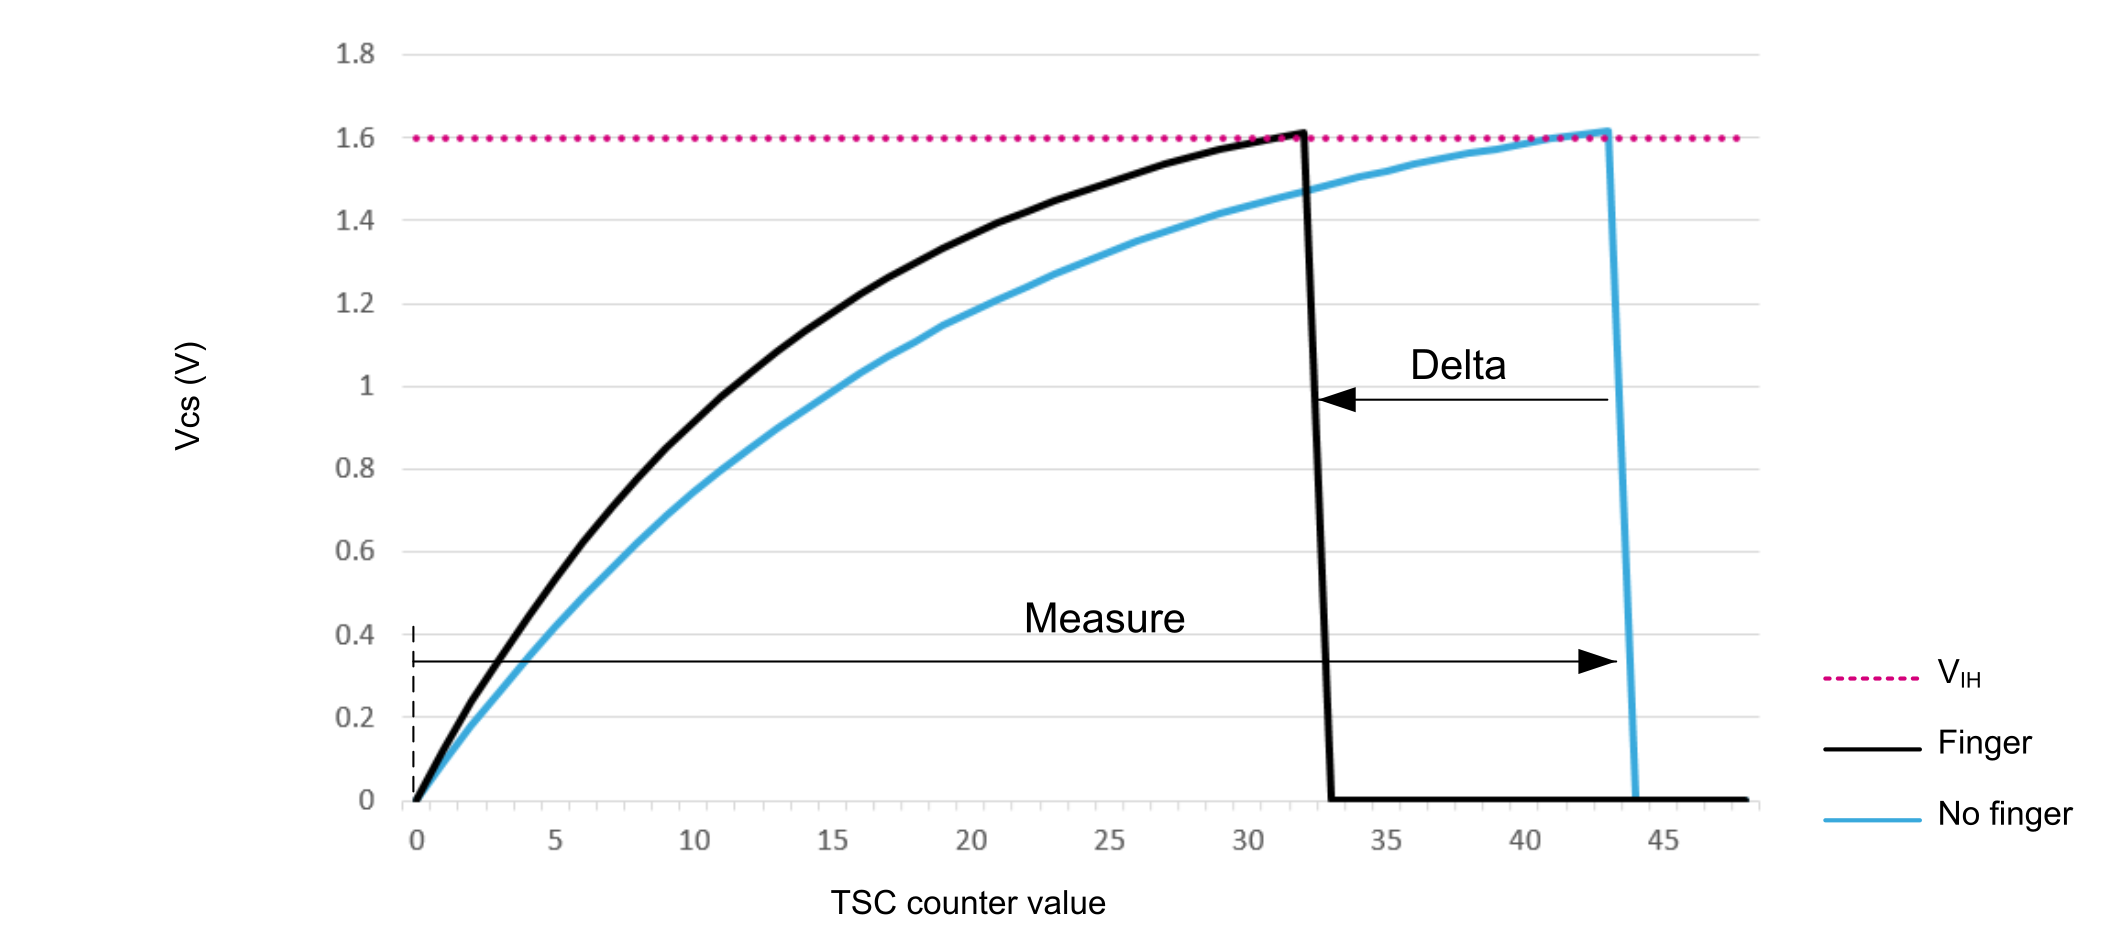
The figure below describes the Cs voltage behavior with and without finger on the sensor. The finger capacitance added on the sensor speeds up the Cs charge. When Vcs reach VIH, the TSC peripheral stops charging the transfer state machine.
After this step, a discharge is done and Vcs goes from VIH to 0 V.
Figure 4. Vcs behavior without noise
Sampling capacitor (Cs) voltage level with noise
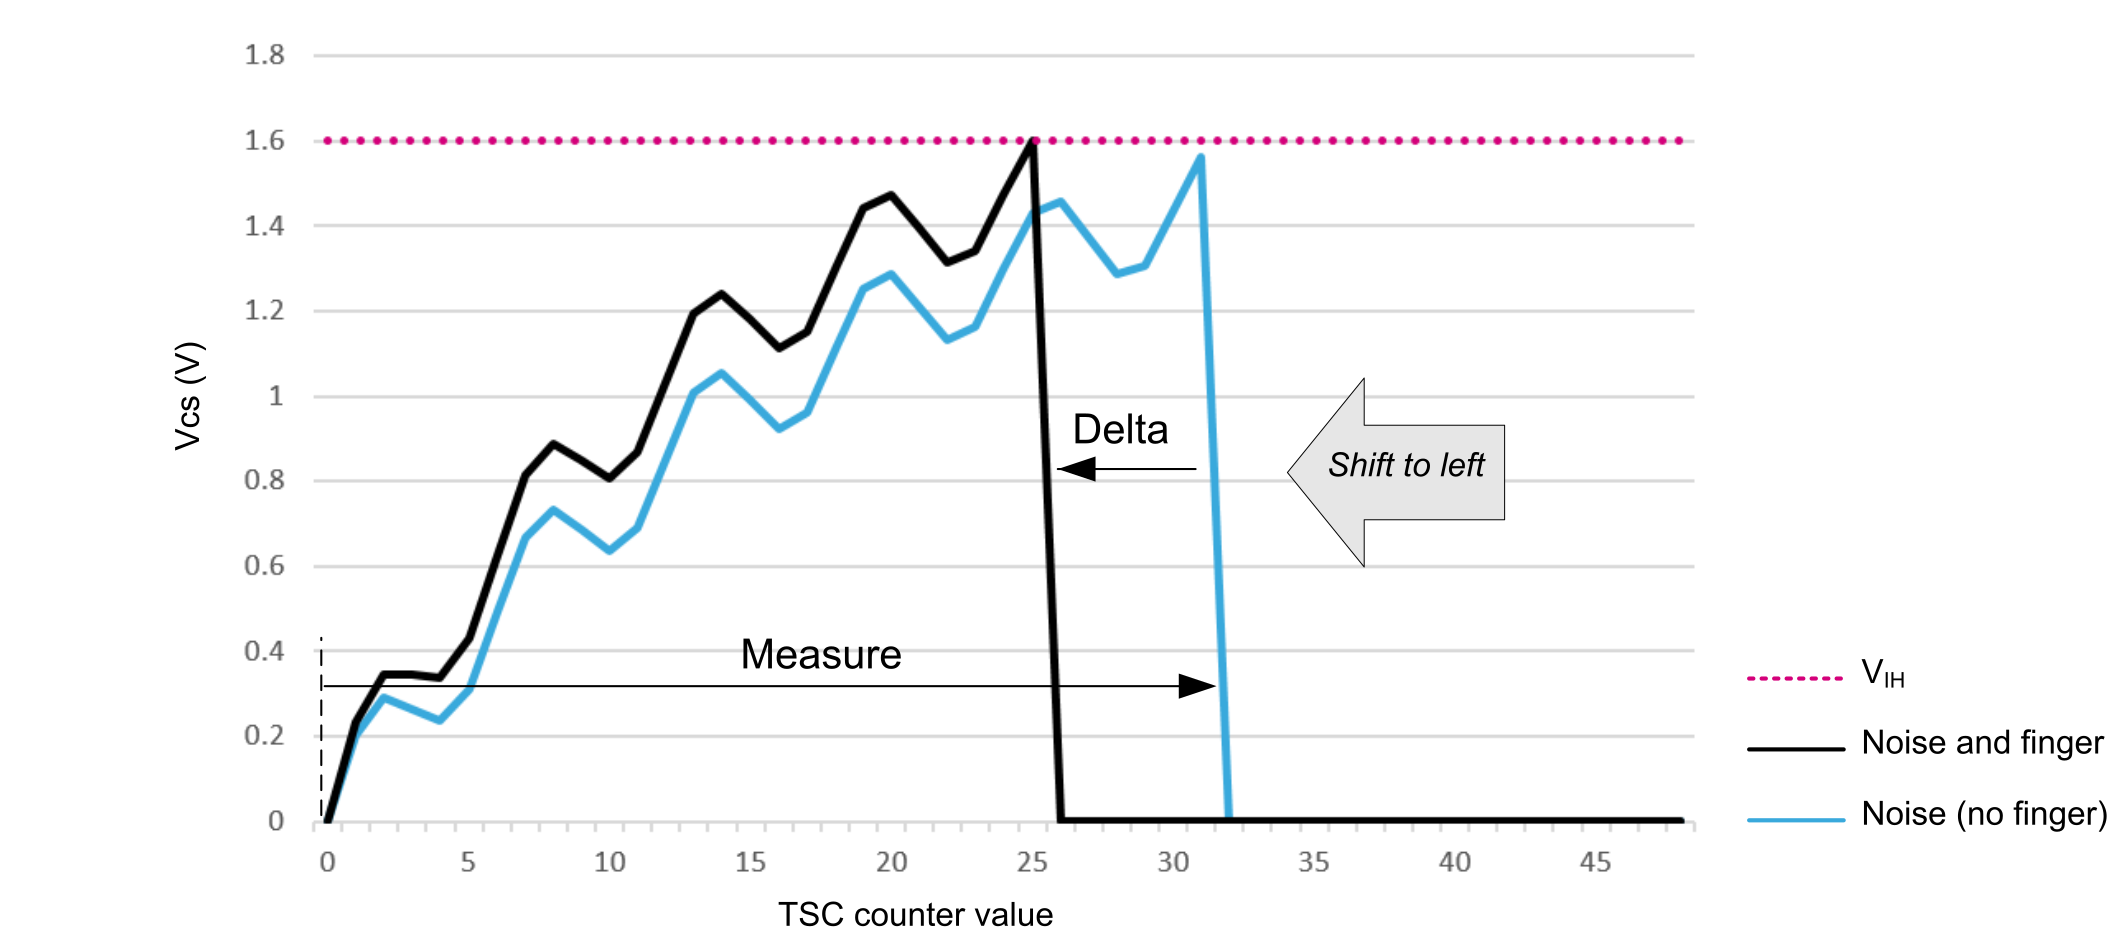
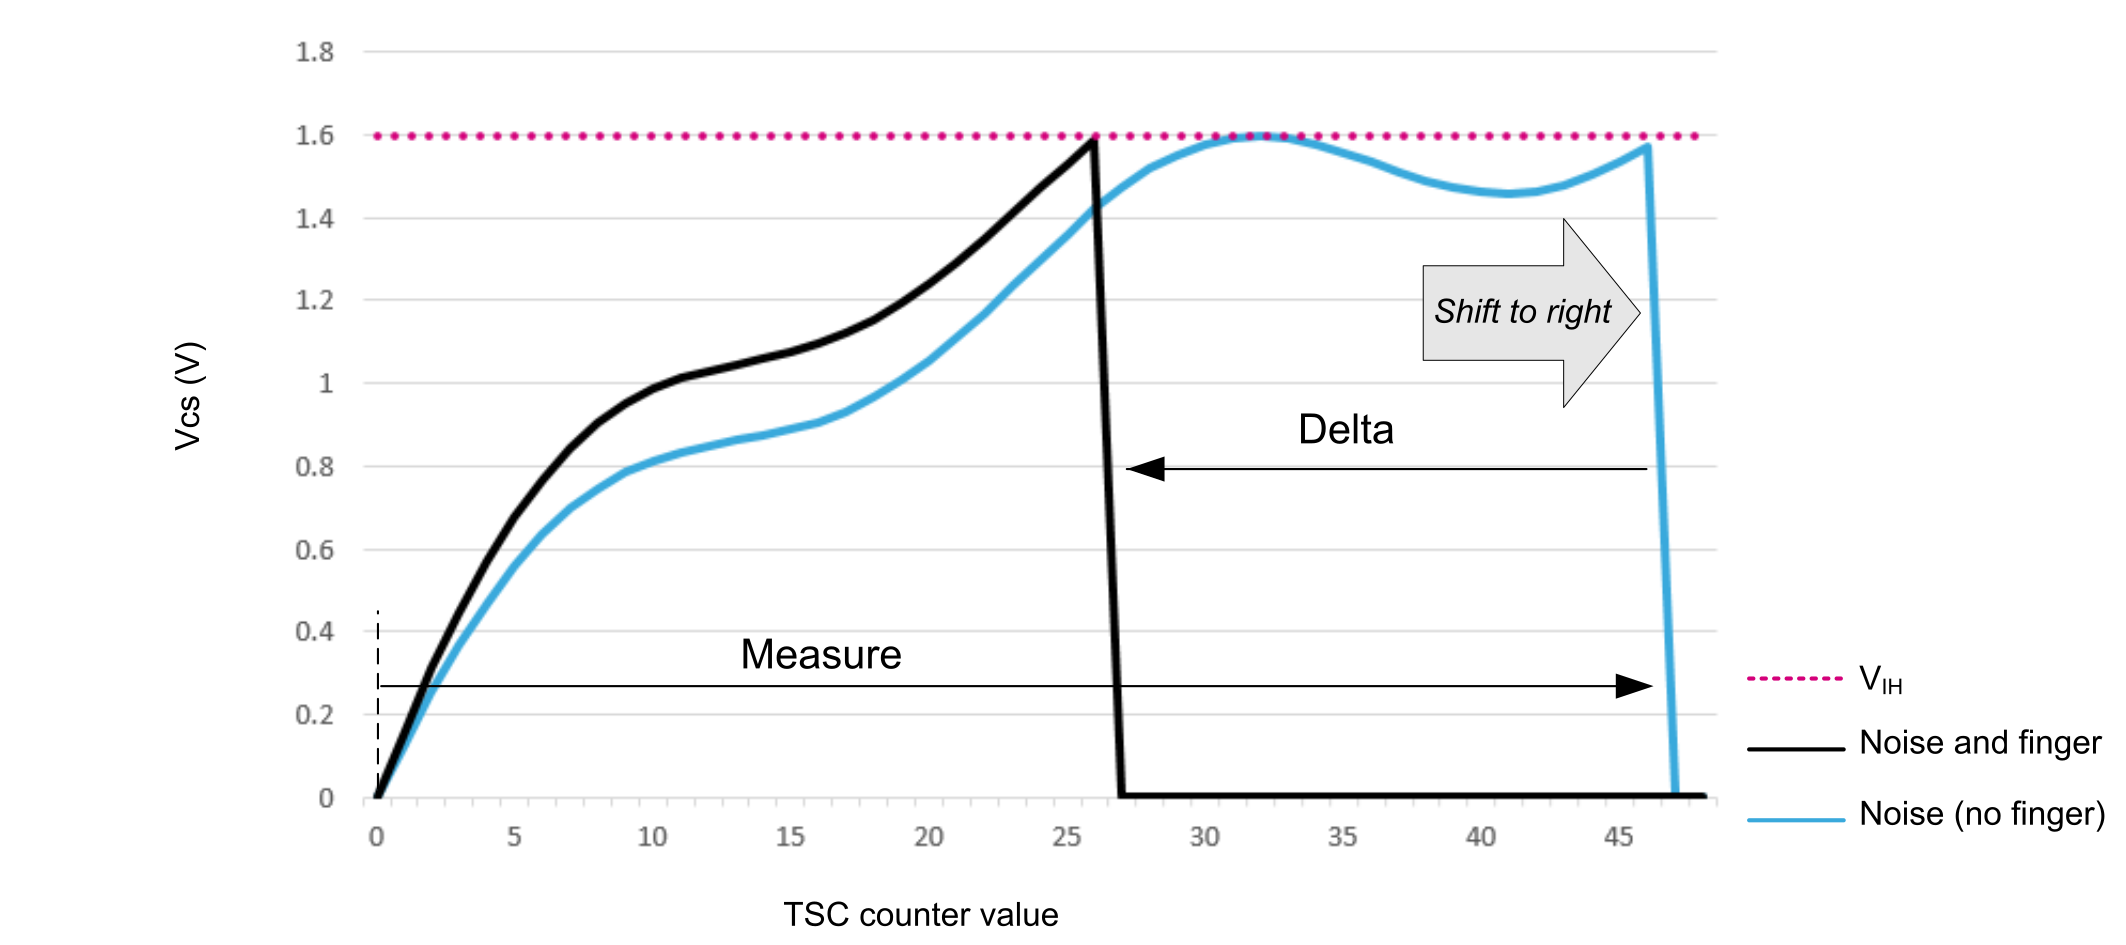
The figures below describe Cs voltage behavior with and without finger on sensor during conducted noise injection.
Figure 5. Vcs behavior with high-frequency conducted noiseFigure 6. Vcs behavior with low-frequency conducted noise
The measure value increases or decreases with the conducted noise frequency range. Regarding the delta value, the behavior is less predictable. The TSL (touch sensing library) debounce feature helps to filter these effects (see debounce and threshold setting in Software filter (debounce)).