General operating conditions
| Symbol | Parameter | Operating conditions | Min | Typ | Max | Unit | |
|---|---|---|---|---|---|---|---|
| VDD/VDDA | Standard operating voltage | - | 2.7(1) | - | 3.6 | V | |
| VIN | I/O Input voltage | All I/O except TT_xx | VSS−0.3 | - | MIN (VDD + 3.6V , 5.5 V)(2) | ||
| TT_xx I/O | VSS−0.3 | - | VDD + 0.3 | ||||
| VCAP | Internal regulator ON | RUN, SLEEP, STOP0 Modes | 1.15 | 1.20 | 1.26 | ||
| STOP1 Mode | 0.9 | 0.95 | 1.0 | ||||
| fHCLK | AHB clock frequency | - | - | - | 144 | MHz | |
| fPCLK | APB clock frequency | - | - | - | 144 | ||
| PD | Power dissipation at TA = 85 °C for suffix 6(3) | - | See Package thermal characteristics for application appropriate thermal resistance and package. Power dissipation is then calculated according ambient temperature (TA) and maximum junction temperature (TJ) and selected thermal resistance. | mW | |||
| Power dissipation at TA = 125 °C for suffix 3(3) | |||||||
| TA | Ambient temperature for suffix 3 version | - | -40 | - | 125 | °C | |
| Ambient temperature for suffix 6 version | - | -40 | - | 85 | |||
| TJ | Junction temperature range for suffix 3 version | - | -40 | - | 140 | °C | |
| Junction temperature range for suffix 6 version. | - | -40 | - | 105 | |||
1 When RESET is released, the functionality is guaranteed down to PDR minimum voltage.
2 For operation with voltage higher than VDD + 0.3 V, the internal pull‑up and pull‑down resistors must be disabled. The minimum and maximum input voltage (Vin) must comply with the selected peripheral enabled on the given GPIOs. Refer to the respective peripheral characteristics for details.
3 If TA is lower, higher PD values are allowed as long as TJ does not exceed TJmax (see Package thermal characteristics).
Operating conditions at power-up/power-down
The parameters given in the table below are derived from tests performed under the ambient temperature condition summarized in Table 17 General operating conditions.
| Symbol | Parameter | Min | Max | Unit |
|---|---|---|---|---|
| tVDD | VDD rise‑time rate | 0 | ∞ | µs/V |
| VDD fall‑time rate | 0 | ∞ | ms/V |
Embedded reset and power control block characteristics
The parameters given in the table below are derived from tests performed under the ambient temperature conditions summarized in Table 17 General operating conditions.
| Symbol | Parameter | Conditions | Min | Typ | Max | Unit |
|---|---|---|---|---|---|---|
| tRSTTEMPO(1)(2) | Reset temporization after POR released | VDD rising | - | - | 463 | µs |
| VPOR/PDR | Power-on/power-down reset threshold (BORH_EN =0) | Rising edge | 2.56 | 2.61 | 2.64 | V |
| Falling edge | 2.53 | 2.58 | 2.61 | |||
| VPVD | Programmable Voltage Detector threshold | Rising edge | 3.00 | 3.04 | 3.08 | |
| Falling edge | 2.89 | 2.93 | 2.96 | |||
| Vhyst_POR_PDR | Hysteresis for power-on/power-down reset | - | - | 30 | - | mV |
| Vhyst_PVD | Hysteresis voltage of PVD | - | - | 110 | - | |
| IDD_PVD(2) | PVD consumption from VDD | - | - | - | 0.63 | µA |
1 Specified by design - Not tested in production.
2 From POR threshold crossing to NRST pull-up resistor activation.
Inrush current and inrush electric charge characteristics
The parameters provided in the following table are specified by design simulation and are not tested in production.
| Symbol | Parameter | Typ | Unit |
|---|---|---|---|
| IRUSH | Inrush current during voltage regulator power-on (POR) or wake-up from standby | 35 | mA |
| QRUSH | Inrush electric charge during voltage regulator power-on (POR) or wake-up from standby. | 2.8 | µC |
Embedded voltage reference
The parameters provided in Table 21 Embedded internal voltage reference are derived from tests performed under the ambient temperature and supply voltage conditions summarized in General operating conditions.
| Symbol | Parameter | Conditions | Min | Typ | Max | Unit |
|---|---|---|---|---|---|---|
| VREFINT | Internal reference voltages | -40°C < TJ < 140 °C | 1.180 | 1.217 | 1.250 | V |
| tS_vrefint(1)(2) | ADC sampling time when reading the internal reference voltage | - | 4.3 | - | - | µs |
| tstart_vrefint (2) | Start time of reference voltage buffer when ADC is enable | - | - | - | 4.4 | µs |
| Irefbuf (2) | Reference Buffer consumption for ADC | VDDA = 3.3 V | 9 | 13.5 | 23 | µA |
| ΔVREFINT (2) | Internal reference voltage spread over the temperature range | -40 °C < TJ < 140 °C | - | 5 | 15 | mV |
| Tcoeff | Average temperature coefficient | Average temperature coefficient | - | 19 | 67 | ppm/°C |
| VDDcoeff | Average Voltage coefficient | 3.0 V < VDD < 3.6 V | - | 10 | 1370 | ppm/V |
| Symbol | Parameter | Memory address | ||||
|---|---|---|---|---|---|---|
| VREFINT_CAL | Raw data acquired at temperature of 30 °C, VDDA = 3.3 V | 0x08FFF810 - 0x08FFF811 | ||||
1 The shortest sampling time for the application can be determined by multiple iterations.
2 Specified by design - Not tested in production.
Supply current characteristics
The current consumption is a function of several parameters and factors such as the operating voltage, ambient temperature, I/O pin loading, device software configuration, operating frequencies, I/O pin switching rate, program location in memory and executed binary code.
The current consumption is measured as described in Current consumption measurement.
Typical and maximum current consumption
The MCU is placed under the following conditions:
- All I/O pins are in analog input mode.
- All peripherals are disabled except when explicitly mentioned.
- The flash memory access time is adjusted with the minimum wait-state number, depending on the fHCLK frequency (refer to the tables Number of wait states according to CPU clock (HCLK) frequency available in the product reference manual).
- When the peripherals are enabled, fPCLK = fHCLK.
The parameters given in the tables below are derived from tests performed under ambient temperature and supply voltage conditions summarized in General operating conditions. If not specified otherwise, typical data are measured with a VDD supply of 3.0 V, and maximum data are measured at 3.6 V.
Current consumption in Run mode
| Symbol | Parameter | Conditions | fHCLK (MHz) | Typ | Max | unit | |||||
|---|---|---|---|---|---|---|---|---|---|---|---|
| TJ = 30°C | TJ = 90°C | TJ = 110°C | TJ = 130°C | TJ = 140°C | |||||||
| IDD(Run)(1) | Supply current in Run mode all peripheral clocks disabled | Code in Flash, ICACHE 2-Ways | 144 | 11.5 | 12.00 | 13.50 | 14.50 | 17.00 | 18.50 | mA | |
| 48 | 4.1 | 4.35 | 5.75 | 7.15 | 9.45 | 11.00 | |||||
| Code in Flash, ICACHE OFF | 144 | 9.4 | 10.00 | 11.50 | 12.50 | 15.00 | 16.50 | ||||
| 48 | 4.0 | 4.35 | 5.70 | 7.05 | 9.35 | 11.00 | |||||
| Code in SRAM2, ICACHE OFF, FLASH ON | 144 | 9.3 | 9.80 | 11.00 | 12.50 | 15.00 | 16.50 | ||||
| 48 | 3.4 | 3.60 | 5.05 | 6.40 | 8.70 | 10.50 | |||||
| Supply current in Run mode all peripheral clocks enabled | Code in Flash, ICACHE 2-Ways | 144(2) | 23.5 | 24.50 | 25.50 | 27.00 | 29.50 | 31.50 | |||
| Code in Flash, ICACHE OFF | 21.0 | 22.50 | 23.50 | 25.00 | 27.50 | 29.00 | |||||
| Symbol | Parameter | Conditions | SYSCLK source | fHCLK (MHz) | Typ | Unit | Typ | Unit | |
|---|---|---|---|---|---|---|---|---|---|
| Peripheral | |||||||||
| IDD(Run)(3) | Supply current in Run mode | Code in Flash, ICACHE 2-WAY, prefetch ON | PSI (4) | 144 | 12.00 | mA | 82.00 | µA/ MHz | |
| Code in Flash, ICACHE 1-WAY, prefetch ON | 9.85 | 68.50 | |||||||
| Code in Flash, ICACHE OFF, prefetch ON | 9.45 | 65.50 | |||||||
| Code in Flash, ICACHE OFF, prefetch OFF | 8.40 | 58.50 | |||||||
| Code in SRAM2, ICACHE 2-WAY | 11.50 | 78.00 | |||||||
| Code in SRAM2, ICACHE 1-WAY | 9.35 | 65.00 | |||||||
| Code in SRAM2, ICACHE OFF | 9.15 | 63.50 | |||||||
1 Measures done with prefetch enabled.
2 Clocked by PSI at 144 MHz with HSE at 16 MHz in bypass mode.
3 Measures done with prefetch enabled.
4 Clocked by PSI 144 MHz with HSE at 16 MHz on bypass mode.
Current consumption in Sleep mode
| Symbol | Parameter | Conditions | fHCLK (MHz) | Typ | Max | Unit | ||||||
|---|---|---|---|---|---|---|---|---|---|---|---|---|
| TJ = 30 °C | TJ = 90 °C | TJ = 110 °C | TJ = 130 °C | TJ = 140 °C | ||||||||
| IDD(SLEEP) | Supply current in Sleep mode | All peripheral clocks disabled | 144 | 2.05 | 2.35 | 3.95 | 5.50 | 8.05 | 10.00 | mA | ||
| 48 | 0.93 | 1.15 | 2.80 | 4.35 | 6.95 | 8.85 | ||||||
| All peripheral clocks enabled | 144 | 15.00 | 15.50 | 17.00 | 18.50 | 21.00 | 22.50 | |||||
| 48 | 5.30 | 5.60 | 7.00 | 8.40 | 11.00 | 12.50 | ||||||
Current consumption in Stop mode
| Symbol | Parameter | Conditions | Typ | Max | Unit | |||||
|---|---|---|---|---|---|---|---|---|---|---|
| TJ = 30 °C | TJ = 90 °C | TJ = 110 °C | TJ = 130 °C | TJ = 140 °C | ||||||
| IDD(STOP) | FLASH ON | SRAM1/2 ON | STOP0 | 0.19 | 0.34 | 1.60 | 2.80 | 4.80 | 6.15 | mA |
| STOP1 | 0.06 | 0.14 | 0.93 | 1.70 | 3.05 | 3.90 | ||||
| FLASH IN LOW POWER | SRAM1/2 ON | STOP0 | 0.17 | 0.32 | 1.60 | 2.75 | 4.75 | 6.10 | ||
| STOP1 | 0.05 | 0.13 | 0.92 | 1.70 | 3.05 | 3.85 | ||||
| SRAM1/2 Powered Down | STOP0 | 0.17 | 0.31 | 1.55 | 2.65 | 4.55 | 5.90 | |||
| STOP1 | 0.05 | 0.12 | 0.82 | 1.50 | 2.70 | 3.55 | ||||
| Symbol | Parameter | Conditions | Typ | Max | Unit | |||||
|---|---|---|---|---|---|---|---|---|---|---|
| TJ = 30 °C | TJ = 90 °C | TJ = 110 °C | TJ = 130 °C | TJ = 140 °C | ||||||
| IDD(Stop) | FLASH IN LOW POWER | HSIKERON, STOP0 | HSI144 | 0.49 | 0.63 | 1.85 | 3.00 | 4.90 | 6.20 | mA |
| HSI48 | 0.38 | 0.52 | 1.75 | 2.90 | 4.80 | 6.10 | ||||
Current consumption in Standby mode
| Symbol | Parameter | RTC and LSE(1) | Typ | Max | Unit | ||||||
|---|---|---|---|---|---|---|---|---|---|---|---|
| 2.7 V | 3 V | 3.3 V | TJ = 30 °C | TJ = 90 °C | TJ = 110 °C | TJ = 130 °C | TJ = 140 °C | ||||
| IDD(Standby) | Supply current in Standby mode, IWDG OFF | OFF | 2.75 | 2.90 | 3.00 | 3.80 | 9.90 | 18.00 | 36.50 | 51.00 | μA |
| ON | 3.10 | 3.25 | 3.40 | - | - | - | - | - | |||
| Supply current in Standby mode, IWDG ON | OFF | 3.10 | 3.25 | 3.40 | 5.10 | 10.00 | 18.00 | 37.00 | 51.00 | ||
| ON | 3.40 | 3.55 | 3.75 | - | - | - | - | - | |||
1 LSE is in bypass mode at 32.768 KHz.
Current consumption from peripherals
| Bus | Peripheral | IDD(Typ) | Unit |
|---|---|---|---|
| AHB1 | SRAM1 | 0.22 | µA/MHz |
| RAMCFG | 0.70 | ||
| ICACHE | 0.20 | ||
| CRC | 0.70 | ||
| FLASH | 6.26 | ||
| LPDMA1 | 1.22 | ||
| LPDMA2 | 1.09 | ||
| SRAM2 | 0.37 | ||
| AHB2 | RNG | 0.78 | µA/MHz |
| HASH | 0.69 | ||
| DAC1 | 0.92 | ||
| ADC12 | 5.51 | ||
| GPIOA | 0.07 | ||
| GPIOB | 0.07 | ||
| GPIOC | 0.09 | ||
| GPIOD | 0.07 | ||
| GPIOE | 0.08 | ||
| GPIOH | 0.06 | ||
| APB1 | FDCAN1 | 4.86 | µA/MHz |
| CRS | 0.23 | ||
| I2C1 | 1.97 | ||
| I2C2 | 2.00 | ||
| I3C1 | 0.28 | ||
| UART4 | 3.47 | ||
| UART5 | 3.43 | ||
| USART2 | 3.69 | ||
| USART3 | 3.62 | ||
| COMP | 0.19 | ||
| SPI2/I2S2 | 1.59 | ||
| SPI3/I2S3 | 1.50 | ||
| WWDG | 0.14 | ||
| TIM2 | 0.28 | ||
| TIM5 | 0.31 | ||
| TIM6 | 0.26 | ||
| TIM7 | 0.29 | ||
| TIM12 | 0.27 | ||
| APB2 | USB | 2.11 | µA/MHz |
| USART1 | 3.39 | ||
| SPI1/I2S1 | 1.50 | ||
| TIM1 | 0.30 | ||
| TIM8 | 0.32 | ||
| TIM15 | 0.33 | ||
| TIM16 | 0.31 | ||
| TIM17 | 0.34 | ||
| APB3 | RTC | 3.47 | µA/MHz |
| LPTIM1 | 0.78 | ||
| LPUART | 2.68 | ||
| SBS | 0.32 |
Wake-up time from low-power modes and voltage scaling transition times
The wake-up times given in the table below are the latency between the event and the execution of the first user instruction.
The device goes in low-power mode after the WFE (wait for event) instruction
| Symbol | Parameter | Conditions | Wakeup clock | fHCLK (MHz) | Typ | Max | Unit |
|---|---|---|---|---|---|---|---|
| twu(Sleep) | Wakeup from Sleep | Instruction cache enabled or disabled | - | - | 16 | CPU clock cycles | |
| twu(Stop) | Wakeup from Stop 0 | Flash memory in normal mode | HSI | 144 | 3.6 | 5 | µs |
| Flash memory in low-power mode | HSI | 144 | 7.2 | 11 | |||
| Flash memory in normal mode | HSIDIV3 | 48 | 5.1 | 7 | |||
| Flash memory in low-power mode | HSIDIV3 | 48 | 8.6 | 13.5 | |||
| Wakeup from Stop 1(1) | Flash memory in normal mode | HSI | 144 | 37.0 | 49 | ||
| Flash memory in low-power mode | HSI | 144 | 40.5 | 58 | |||
| Flash memory in normal mode | HSIDIV3 | 48 | 39.0 | 53 | |||
| Flash memory in low-power mode | HSIDIV3 | 48 | 42.0 | 61 | |||
| twu(Standby) | Wakeup from Standby mode(1) | - | HSIDIV3 | 48 | 445 | - | |
| Symbol | Parameter | Condition | Typ | Max(2) | Unit |
|---|---|---|---|---|---|
|
tWUUSART/ | Wake-up time needed to calculate the maximum USART/LPUART baudrate allowing to wake up from Stop mode when USART/LPUART clock source is 48 MHz by HSIDIV3 | Stop 0 mode | 4.8 | 6.6 | µs |
| Stop 1 mode |
1 Those parameters depend on VCAP capacitance value and VCAP voltage at the instant of the wake-up event.
2 Specified by design - Not tested in production.
External clock timing characteristics
High-speed external user clock generated from an external source
In bypass mode, the HSE oscillator is switched off and the input pin is a standard GPIO.
The external clock signal has to respect the I/O characteristics in I/O port characteristics. However, the recommended clock input waveform is shown in the figure below.
| Symbol | Parameter | Conditions | Min | Typ | Max | Unit |
|---|---|---|---|---|---|---|
| fHSE_ext | User external clock source frequency | Digital mode (HSEYBYP = 1, HSEEXT = 1) | - | - | 50 | MHz |
| Analolog mode (HSEYBYP = 1, HSEEXT = 0) | 4 | - | 50 | |||
| VHSEH | OSC_IN input pin high-level voltage | Digital mode (HSEYBYP = 1, HSEEXT = 1) | 0.7 × VDD | - | VDD | V |
| VHSEL | OSC_IN input pin low-level voltage | Digital mode (HSEYBYP = 1, HSEEXT = 1) | VSS | - | 0.3 × VDD | |
|
tw(HSEH)(1) tw(HSEL)(1) | OSC_IN high or low time | Digital mode (HSEYBYP = 1, HSEEXT = 1) | 7 | - | - | ns |
| DuCyHSE | OSC_IN duty cycle | Digital mode (HSEYBYP = 1, HSEEXT = 1) | 45 | - | 55 | % |
| VHSE_ext_PP(2) | OSC_IN peak-to-peak amplitude | Analog mode (HSEBYP = 1, HSEEXT = 0) | 0.2 | - | 2/3 VDD | V |
| VHSE_ext | OSC_IN input range | 0 | - | VDD | ||
| tr(HSE), tf(HSE) | OSC_IN rise and fall time | 0.05 / fext_ext | - | 0.3 / fext_ext | ns |


1 There is no specified rise and fall time for a digital input signal, but the VHSEH and VHSEL conditions must be fulfilled .
2 The DC component of the signal must ensure that the signal peaks are located between VDD and VSS.
Low-speed external user clock generated from an external source
In bypass mode, the LSE oscillator is switched off and the input pin is directly connected to the LSE clock detector (LSECSS). The external clock signal has to respect the parameters specified in Table 33 Low-speed external user clock characteristics, as shown also by the waveforms in Figure 16 Low-speed external clock source AC timing diagram.
| Symbol | Parameter | Conditions | Min | Typ | Max | Unit |
|---|---|---|---|---|---|---|
| fLSE_ext | User external clock source frequency | External digital/analog clock | - | 32.768 | 1000 | kHz |
| VLSEH | Digital OSC_IN input high level | External digital clock | 0.7 VDD | - | VDD | V |
| VLSEL | OSC32_IN input pin low level voltage | External digital clock | VSS | - | 0.3 VDD | |
| tw(LSEH)/tw(LSEL) | OSC32_IN high or low time | External digital clock | 250 | - | - | ns |
| Vlsw_H | Analog low swing OSC_IN high level | External analog low swing clock | 0.6 | 1.225 | V | |
| Vlsw_L | Analog low swing OSC_IN low level | External analog low swing clock | 0.35 | 0.8 | ||
| VlswLSE (VLSEH - VLSEL) | Analog low swing OSC_IN peak-to-peak amplitude | External analog low swing clock | 0.2 | 0.875 | ||
| DuCyLSE | Analog low swing OSC_IN duty cycle | External analog Low Swing Clock | 45 | 50 | 55 | % |
| trLSE/tfLSE | Analog low swing OSC_IN rise and fall time | Externala analog low swing clock 10 % to 90 % | - | 100 | 200 | ns |

High-speed external clock generated from a crystal/ceramic resonator
The high-speed external (HSE) clock can be supplied with a 4 to 48 MHz crystal/ceramic resonator oscillator. All the information given in this paragraph are based on design simulation results obtained with typical external components specified in the table below.
In the application, the resonator and the load capacitors have to be placed as close as possible to the oscillator pins, in order to minimize the output distortion and startup stabilization time. Refer to the crystal resonator manufacturer for more details on the resonator characteristics (frequency, package, accuracy).
| Symbol | Parameter | Operating conditions(1) | Min | Typ | Max | Unit |
|---|---|---|---|---|---|---|
| F | Oscillator frequency | - | 4 | - | 50 | MHz |
| RF | Feedback resistor | - | - | 200 | - | kΩ |
| IDD(HSE) | HSE current consumption | During startup(2) | - | - | 10 | mA |
| VDD = 3 V, Rm = 20 Ω CL=10 pF at 4 MHz | - | 0.4 | - | |||
| VDD=3 V, Rm = 20 Ω CL = 10 pF at 8 MHz | - | 0.4 | - | |||
| VDD = 3 V, Rm = 20 Ω CL = 10 pF at 16 MHz | - | 0.6 | - | |||
| VDD = 3 V, Rm = 20 Ω CL = 10 pF at 32 MHz | - | 0.7 | - | |||
| VDD = 3 V, Rm = 20 Ω CL=10 pF at 48 MHz | - | 1.2 | - | |||
| Gmcritmax | Maximum critical crystal gm | Startup | - | - | 1.5 | mA/V |
| tSU(3) | Start-up time | VDD is stabilized | - | 2 | - | ms |
Note:
For information on selecting the crystal, refer to the application note 'Oscillator design guide for STM8AF/AL/S, STM32 MCUs and MPUs' (AN2867).

(1): REXT value depends on the crystal characteristics.
1 Resonator characteristics given by the crystal/ceramic resonator manufacturer.
2 This consumption level occurs during the first 2/3 of the tSU(HSE) startup time.
3 tSU(HSE) is the startup time measured from the moment it is enabled (by software) to a stabilized 8 MHz oscillation is reached. This value is measured for a standard crystal resonator and it can vary significantly with the crystal manufacturer.
Low-speed external clock generated from a crystal resonator
The low-speed external (LSE) clock can be supplied with a 32.768 kHz crystal resonator oscillator. All the information given in this paragraph are based on design simulation results obtained with typical external components specified in the table below. In the application, the resonator and the load capacitors have to be placed as close as possible to the oscillator pins in order to minimize output distortion and startup stabilization time. Refer to the crystal resonator manufacturer for more details on the resonator characteristics (frequency, package, accuracy).
| Symbol | Parameter | Operating conditions(1) | Min | Typ | Max | Unit |
|---|---|---|---|---|---|---|
| F | Oscillator frequency | - | - | 32.768 | - | kHz |
| IDD | LSE current consumption | LSEDRV[1:0] = 00, Low drive capability | - | 246 | - | nA |
| LSEDRV[1:0] = 01, Medium low drive capability | - | 333 | - | |||
| LSEDRV[1:0] = 10, Medium high drive capability | - | 462 | - | |||
| LSEDRV[1:0] = 11, High drive capability | - | 747 | - | |||
| Gmcritmax | Maximum critical crystal Gm | LSEDRV[1:0] = 00, Low drive capability | - | - | 0.5 | µA/V |
| LSEDRV[1:0] = 01, Medium low drive capability | - | - | 0.75 | |||
| LSEDRV[1:0] = 10, Medium high drive capability | - | - | 1.7 | |||
| LSEDRV[1:0] = 11, High drive capability | - | - | 2.7 | |||
| tSU(2) | Startup time | VDD is stabilized | - | 2 | - | s |
Note:
For information on selecting the crystal, refer to the application note 'Oscillator design guide for STM8AF/AL/S, STM32 MCUs and MPUs' (AN2867).
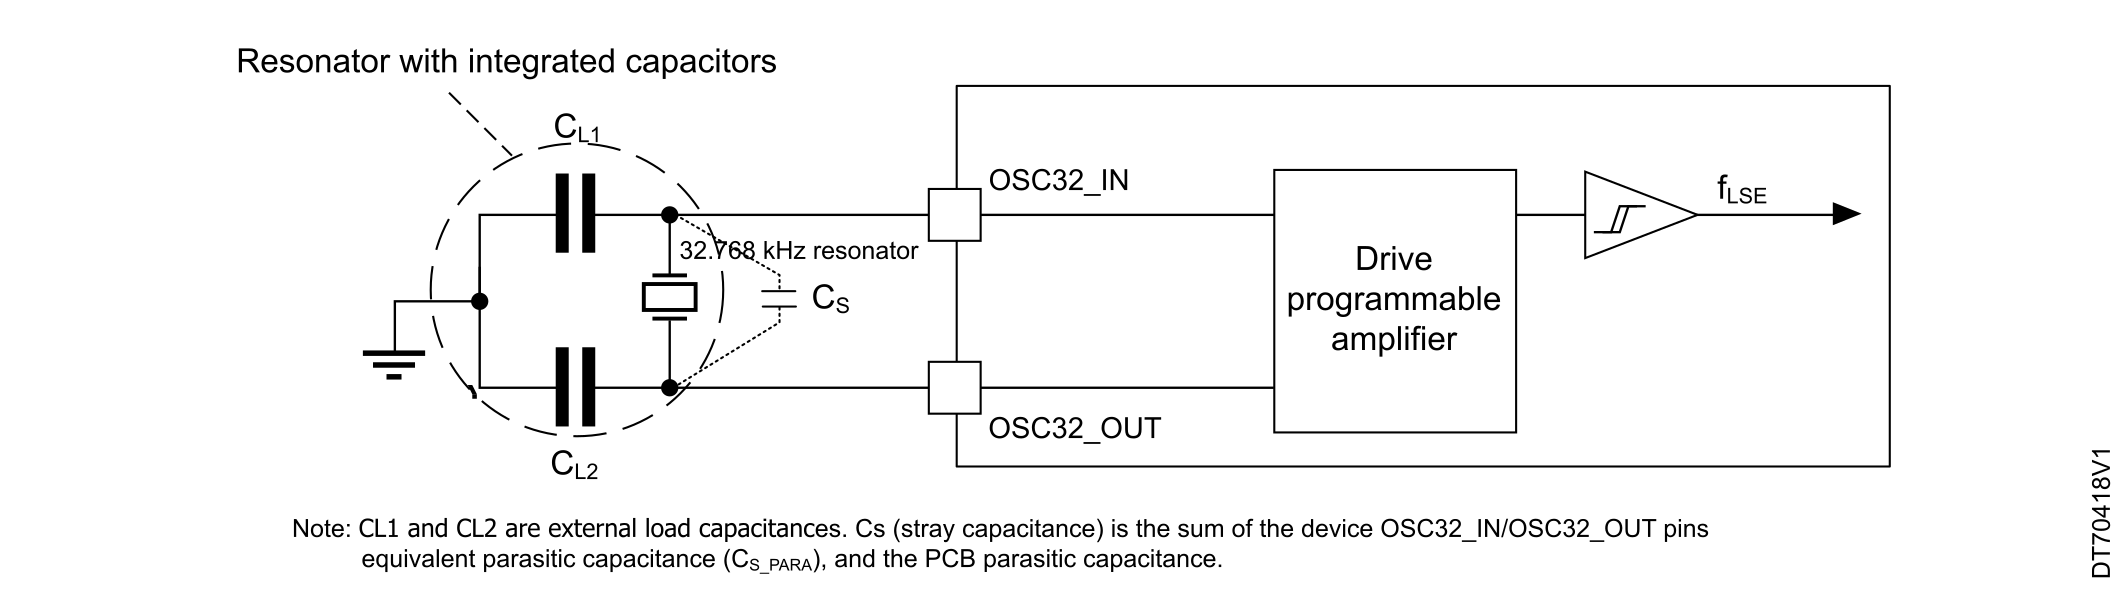
Note:
An external resistor is not required between OSC32_IN and OSC32_OUT and it is forbidden to add one.
1 Refer to the following note and caution paragraphs, and to the application note AN2867 “Oscillator design guide for ST microcontrollers.
2 tSU is the startup time measured from the moment it is enabled (by software) to a stabilized 32.768k Hz oscillation is reached. This value is measured for a standard crystal resonator and it can vary significantly with the crystal manufacturer.
Internal clock timing characteristics
The parameters given in the tables below are derived from tests performed under ambient temperature and supply voltage conditions summarized in Table 17 General operating conditions. The curves provided are characterization results, not tested in production.
High-speed internal HSI144 oscillator
| Symbol | Parameter | Conditions | Min | Typ | Max | Unit |
|---|---|---|---|---|---|---|
| fHSI(1) | HSI frequency | VDD = 3.3 V, TJ = 30 °C | 144.07 | - | 145.08 | MHz |
| TRIM(2) | USER trimming step | - | - | 0.1 | 0.15 | % |
| USER TRIM COVERAGE(2) | USER TRIMMING Coverage positive | 80 steps | 5.2% | 8% | - | |
| USER TRIMMING Coverage negative | 48 steps | -3.1% | -4.8% | - | ||
| DuCy(HSI)(2) | Duty Cycle | - | 45 | 55 | ||
| ΔTEMP (HSI)(3) | HSI oscillator frequency drift over temperature (the reference is 144 MHz.) | TJ = -20 to 130 °C | -1 | - | 1 | |
| TJ = −40 to TJmax °C | -1.5 | - | 1.5 | |||
| ΔVDD(HSI)(2)(4) | HSI oscillator frequency drift with VDD#id_68738__fn_hj1_gsm_ghc (5)(the reference is 3.3V) | VDD from 2.7 V to 3.6 V | - | - | - 0.1 | |
| tsu(HSI)(3) | HSI oscillator start-up time (PSI Off) | - | - | 3 | 4.5 | µs |
| HSI oscillator start-up time (PSI On) | - | - | 0.5 | - | ||
| tstab(2) | stabilization time (PSI OFF from Enable) | +/-1% of target freq | - | - | 8 | |
| stabilization time (PSI ON from Enable) | - | - | 0.7 | |||
| IDD(HSI)(2)(6) | HSI supply regulation block oscillator power consumption | - | - | 91 | - | µA |
| HSI oscillator power consumption | - | - | 28 | - | ||
| NT jitter(2) | Next transition jitter(7). | On HSIDIV3 | - | 52 | 322 | ps |
| PT jitter(2) | Paired transition jitter(8) | - | 62 | 394 | ||
| Per jitter(2) | Period Jitter standard deviation | On HSIS | 15 | |||
| On HSIDIV3 | 26 |

1 Tested in production.
2 Specified by design - Not tested in production.
3 Evaluated by characterization - Not tested in production.
4 ΔfHSI = ΔTEMP + ΔVDD
5 These values are obtained by using formula: (Freq(3.6 V) - Freq(3.3 V)) / Freq(3.3 V) or (Freq(3.6 V) - Freq(2.7 V)) / Freq(2.7 V).
6 The supply regulation consumption is common to HSI and PSI. (To be counted once if both oscillators are ON).
7 Jitter measurements are performed without clock source activated in parallel. Typical value is standard deviation, Maximum is peak measure on TIE-8 over 36 cycles.
8 Jitter measurements are performed without clock source activated in parallel. Typical value is standard deviation, Maximum is peak measure on TIE-16 over 36 cycles.
PSI oscillator characteristics
| Symbol | Parameter | Conditions | Min(1) | Typ | Max | Unit |
|---|---|---|---|---|---|---|
| fPSI | PSI potential frequency |
If reference is HSE at 8, 16, 24, 32 or 48 MHz or HSIDIV18 | - | 100 | - | MHz |
| - | 144 | - | ||||
| - | 160(2) | - | ||||
| If reference is HSE at 25 or 50 MHz | - | 100 | - | |||
| - | 141.67 | - | ||||
| - | 158.33(2) | - | ||||
| If reference is LSE at 32 KHz | - | 100.008 | - | |||
| - | 144.015 | - | ||||
| - | 160.006(2) | - | ||||
| DuCy(PSI)(3) | Duty Cycle | - | 45 | 55 | % | |
| tsu(PSI)(4) | PSI startup time | On 32 KHz | - | 850 | 1750 | µs |
| PSI startup time | On 8 MHz | - | 25 | 45 | µs | |
| IDD(PSI)(3)(5) | PSI supply regulation bloc oscillator power consumption | If HSI not ON | - | 91 | - | µA |
| PSI oscillator power consumption | 100 MHz | - | 95 | - | ||
| PSI oscillator power consumption | 144 MHz | - | 68 | - | ||
| PSI oscillator power consumption | 160 MHz | - | 77 | - | ||
| NT jitter(3) | Next transition jitter(6) |
On PSIDIV3 (48 MHz with 32 kHz CK_IN) | - | 46.8 | 264 | ps |
|
On PSIDIV3 (48 MHz with 8 MHz CK_IN) | - | 52.6 | 276 | ps | ||
| PT jitter(3) | Paired transition jitter (7) |
On PSIDIV3 (48 MHz with 32 kHz CK_IN) | - | 54.4 | 331 | ps |
|
On PSIDIV3 (48 MHz with 8 MHz CK_IN) | - | 60.6 | 367 | ps | ||
| Per jitter(3) | Period Jitter standard deviation |
On PSIS (100 MHz) | - | 15.5 | - | ps |
|
On PSIDIV3 (33.33 MHz) | - | 27 | - | ps | ||
|
On PSIS (144 MHz) | - | 14 | - | ps | ||
|
On PSIDIV3 (48 MHz) | - | 24.5 | - | ps | ||
|
On PSIS (160 MHz) | - | 13.5 | - | ps | ||
|
On PSIDIV3 (53.33 MHz) | - | 23 | - | ps | ||
| LT jitter(3) | Long term jitter ethernet |
On PSIS (100 MHz with 32 kHz CK_IN) | - | - |
13.7 (RMS) 96.7 (peak) | ns |
|
On PSIS (100 MHz with 8 MHz CK_IN ) | - | - |
0.79 (RMS) 6.69 (peak) | ns | ||
| Long term jitter FDCAN |
On PSIK (40 MHz with 32 kHz CK_IN) | - | - |
13.3 (RMS) 83.6 (peak) | ns | |
|
On PSIK (40 MHz with 8 MHz CK_IN) | - | - |
0.775 (RMS) 6.16 (peak) | ns |
1 Tested in production.
2 Frequencies above the supported product's maximum frequency can only be used once divided through PSIK or PSIDIV4 dividers.
3 Specified by design - Not tested in production.
4 Evaluated by characterization - Not tested in production.
5 The supply regulation consumption is common to HSI and PSI. (To be counted once if both oscillators are ON)
6 Jitter measurements are performed without clock source activated in parallel. The typical value refer to the standard deviation, while the maximum is the peak measurement of TIE-8 over 36 cycles.
7 Jitter measurements are performed without clock source activated in parallel. The typical value refer to the standard deviation, while the maximum is the peak measurement of TIE-16 over 36 cycles.
Low-speed internal (LSI) RC oscillator
| Symbol | Parameter | Conditions | Min | Typ | Max | Unit |
|---|---|---|---|---|---|---|
| fLSI | LSI frequency | VDD = 3.3 V, TJ = 25°C | 31.4(1) | 32 | 32.6(1) | kHz |
| TJ = -40 to 130°C | 29.4(2) | 33.6(2) | ||||
| TJ = -40 to 140°C | 28.6(2) | - | 33.6(2) | |||
| tsu(LSI)(3) | LSI oscillator startup time | - | - | 80 | 130 | µs |
| tstab(LSI)(3) | LSI oscillator stabilization time (5% of final value) | - | - | 120 | 170 | |
| IDD(LSI)(3) | LSI oscillator power consumption | - | - | 130 | 280 | nA |
1 Guaranteed by test production.
2 Evaluated by characterization - Not tested in production.
3 Specified by design - Not tested in production.
Flash memory characteristics
| Symbol | Parameter | Conditions | Min | Typ | Max | Unit |
|---|---|---|---|---|---|---|
| IDD | Supply current | Word program | - | 1 | - | mA |
| Page erase | - | 0.8 | - | |||
| Mass erase | - | 0.8 | - |
| Symbol | Parameter | Conditions | Min(1) | Typ | Max(1) | Unit |
|---|---|---|---|---|---|---|
| tprog | Word programming time | 128 bits (user area) | - | 20.0 | 160.0 | µs |
| 16 bits (OTP / EDATA area) | - | 20.0 | 160.0 | |||
| tERASE 8KB | Page (8 KB) erase time | - | - | 2.0 | 2.1 | ms |
| tERASE 2KB | Page (2 KB) erase time | - | - | 2.0 | 2.1 | |
| tME | Bank Mass erase time | - | - | 96.0 | ||
| Mass erase time | - | - | 192.0 | 200.0 | ||
| Vprog | Programming voltage | - | 2.65 | - | 3.6 | V |
| Symbol | Parameter | Conditions | Min(2) | Unit |
|---|---|---|---|---|
| NEND | Endurance | TJ = -40 to 140 °C | 10 | Kcycle |
| tRET | Data retention | 1 Kcycle at TJ = 125 °C | 10 | Year |
| 1 Kcycle at TJ = 85 °C | 30 | |||
| 10 Kcycle at TJ = 55 °C | 30 |
1 Evaluated by characterization - Not tested in production.
2 Evaluated by characterization - Not tested in production.
EMC characteristics
Susceptibility tests are performed on a sample basis during device characterization.
Functional EMS (electromagnetic susceptibility)
While a simple application is executed on the device (toggling two LEDs through the I/O ports), the device is stressed by two electromagnetic events until a failure occurs. The failure is indicated by the LEDs as follows:
- Electrostatic discharge (ESD) (positive and negative): applied to all device pins until a functional disturbance occurs. This test is compliant with the IEC 61000-4-2 standard.
- FTB (fast transient voltage burst) (positive and negative): applied to VDD and VSS pins through a 100 pF capacitor, until a functional disturbance occurs. This test is compliant with the IEC 61000-4-4 standard.
A device reset allows normal operations to be resumed.
The test results are given in the table below. They are based on the EMS levels and classes defined in application note EMC design guide for STM8, STM32 and Legacy MCUs (AN1709).
| Symbol | Parameter | Conditions | Level/Class | |
|---|---|---|---|---|
| VFESD | Voltage limits to be applied on any I/O pin to induce a functional disturbance | VDD = 3.3 V, TA = 25°C, fHCLK = 144 MHz, LQFP100 package conforming to IEC 61000-4-2 | 2B | |
| VEFTB | Fast transient voltage burst limits to be applied through 100 pF on VDD and VSS pins to induce a functional disturbance | VDD = 3.3 V, TA = 25°C, fHCLK = 144 MHz, LQFP100 package conforming to IEC 61000-4-4 | 5A | |
Designing hardened software to avoid noise problems
The EMC characterization and optimization are performed at component level with a typical application environment and simplified MCU software. Note that good EMC performance is highly dependent on the user application and the software in particular.
Therefore it is recommended that the user applies EMC software optimization and prequalification tests in relation with the EMC level requested for the application.
Software recommendations
The software flowchart must include the management of runaway conditions such as:
- Corrupted program counter
- Unexpected reset
- Critical data corruption (control registers)
Prequalification trials
Most of the common failures (unexpected reset and program counter corruption) can be reproduced by manually forcing a low state on the NRST pin or the oscillator pins for one second.
To complete these trials, ESD stress can be applied directly on the device, over the range of specification values. When unexpected behavior is detected, the software can be hardened to prevent unrecoverable errors occurring. See application note Software techniques for improving microcontrollers EMC performance (AN1015) for more details.
Electromagnetic Interference (EMI)
The electromagnetic field emitted by the device is monitored while a simple application is executed (toggling two LEDs through the I/O ports). This emission test is compliant with IEC 61967-2 standard that specifies the test board and the pin loading.
| Symbol | Parameter | Conditions | Monitored frequency band | Value | Unit |
|---|---|---|---|---|---|
| SEMI | Peak(1) |
VDD = 3.6 V, TA = 25 ° C, LQFP100 package compliant with IEC 61967-2 | 0.1 MHz to 30 MHz | 16 | dBμV |
| 30 MHz to 130 MHz | -1 | ||||
| 130 MHz to 1 GHz | 21 | ||||
| 1 GHz to 2 GHz | 13 | ||||
| Level(2) | 0.1 MHz to 2 GHz | 3.5 | - |
1 Refer to the EMI radiated test section of the application note EMC design guide for STM8, STM32 and Legacy MCUs (AN1709).
2 Refer to the EMI level classification section of the application note EMC design guide for STM8, STM32 and Legacy MCUs (AN1709).
Electrical sensitivity characteristics
Based on three different tests (ESD, latch-up) using specific measurement methods, the device is stressed in order to determine its performance in terms of electrical sensitivity.
Electrostatic discharge (ESD)
Electrostatic discharges (a positive then a negative pulse separated by 1 second) are applied to the pins of each sample according to each pin combination. The sample size depends on the number of supply pins in the device (3 parts × (n+1) supply pins). This test conforms to the ANSI/JEDEC standard.
| Symbol | Ratings | Conditions | Packages | Class | Maximum value(1) | Unit |
|---|---|---|---|---|---|---|
| VESD(HBM) | Electrostatic discharge voltage (human body model) | TA = 25°C conforming to ANSI/ESDA/JEDEC JS-001 | LQFP100 | 2 | 3400(2) | V |
| LQFP80 | ||||||
| LQFP64 | ||||||
| LQFP64 alternative pinout | 3A | 4000 | ||||
| LQFP48 | 2 | 3400(2) | ||||
| UFQFPN48 | ||||||
| LQFP32 | ||||||
| UFQFPN32 | ||||||
| VESD(CDM) | Electrostatic discharge voltage (charge device model) | TA = 25°C conforming to ANSI/ESDA/JEDEC JS-002 | LQFP100 | C3 | 1000 | |
| LQFP80 | 1000 | |||||
| LQFP64 | 1250 | |||||
| LQFP64 alternative pinout | 1250 | |||||
| LQFP48 | 1250 | |||||
| UFQFPN48 | 1250 | |||||
| LQFP32 | 1250 | |||||
| UFQFPN32 | 1250 |
Static latch-up
The following complementary static tests are required on three parts to assess the latch-up performance:
- A supply overvoltage is applied to each power supply pin.
- A current injection is applied to each input, output, and configurable I/O pin.
These tests are compliant with EIA/JESD 78E IC latch-up standard.
| Symbol | Parameter | Conditions | Class |
|---|---|---|---|
| LU | Static latch-up class | TA = 130°C conforming to JESD78 | Level II A |
1 Evaluated by characterization - Not tested in production.
2 All pins are characterized at a maximum value of 4000 V, except for PC14, whose maximum value is 3400 V, and PC15, whose maximum value is 3600 V.
I/O current injection characteristics
As a general rule, the current injection to the I/O pins, due to external voltage below VSS or above VDDIOx (for standard, 3.3 V‑capable I/O pins) must be avoided during normal product operation. However, in order to give an indication of the robustness of the microcontroller if abnormal injection accidentally happens, some susceptibility tests are performed on a sample basis during the device characterization.
Functional susceptibility to I/O current injection
While a simple application is executed on the device, the device is stressed by injecting current into the I/O pins programmed in floating-input mode. While this current is injected into the I/O pin, one at a time, the device is checked for functional failures.
The failure is indicated by an out-of-range parameter, such as an ADC error above a certain limit (higher than 5 LSB TUE), out of conventional limits of induced leakage current on adjacent pins (out of the 5 µA/+0 µA range), or other functional failure (for example reset occurrence or oscillator frequency deviation).
The characterization results are given in the table below. The negative induced leakage current is caused by the negative injection. The positive induced leakage current is caused by the positive injection.
| Symbol | Description | Functional susceptibility | Unit | |
|---|---|---|---|---|
| Negative injection | Positive injection | |||
| IINJ | Injected current on PA4 pins | 0 | 0 | mA |
| Injected current on PB13, PB14, PB15, PD8, PD9, PD10, PD11, PD12, PD13, PE0, and PE1 pins | 0 | N/A | ||
| Injected current on all other pins | 5 | N/A | ||
I/O port characteristics
General input/output characteristics
Unless otherwise specified, the parameters given in Table 47 I/O static characteristics are derived from tests performed under the conditions summarized in Table 17 General operating conditions. All I/Os are designed as CMOS and TTL-compliant.
Note:
For information on GPIO configuration, refer to the application note STM32 GPIO configuration for hardware settings and low‑power consumption (AN4899).
| Symbol | Parameter | Condition | Min | Typ | Max | Unit |
|---|---|---|---|---|---|---|
| VIL | I/O input low level voltage | 2.7 V<VDDIOx<3.6 V | - | - | 0.3VDD (1) | V |
| I/O input low level voltage | - | - | 0.4 VDD - 0.1(2) | |||
| VIH | I/O input high level voltage | 2.7 V < VDDIOx < 3.6 V | 0.7VDD (1) | - | - | V |
| I/O input high level voltage | 0.52VDD + 0.18(2) | - | - | |||
| VHYS (2) | TT_xx, FT_xxx and NRST I/O input hysteresis | 2.7 V < VDDIOx < 3.6 V | - | 300 | - | mV |
| Ileak (3) | FT_xx Input leakage current(2) | 0 < VIN ≤ Max(VDDXXX)(4) | - | - | ±-200 | nA |
| Max(VDDXXX) < VIN ≤ Max(VDDXXX + 1 V)(5)(6)(4) | - | - | ±2500 | |||
| Max(VDDXXX + 1) < VIN ≤ 5.5 V (5)(6)(4) | - | - | 750 | |||
| TT_xx Input leakage current | 0 < VIN ≤ Max(VDDXXX + 1 V)(4) | - | - | ±200 | ||
| RPU | Weak pull-up equivalent resistor(7) | VIN = VSS | 30 | 40 | 50 | kΩ |
| RPD | Weak pull-down equivalent resistor(7) | VIN = VDD | 30 | 40 | 50 | |
| CIO | I/O pin capacitance | - | - | 5 | - | pF |
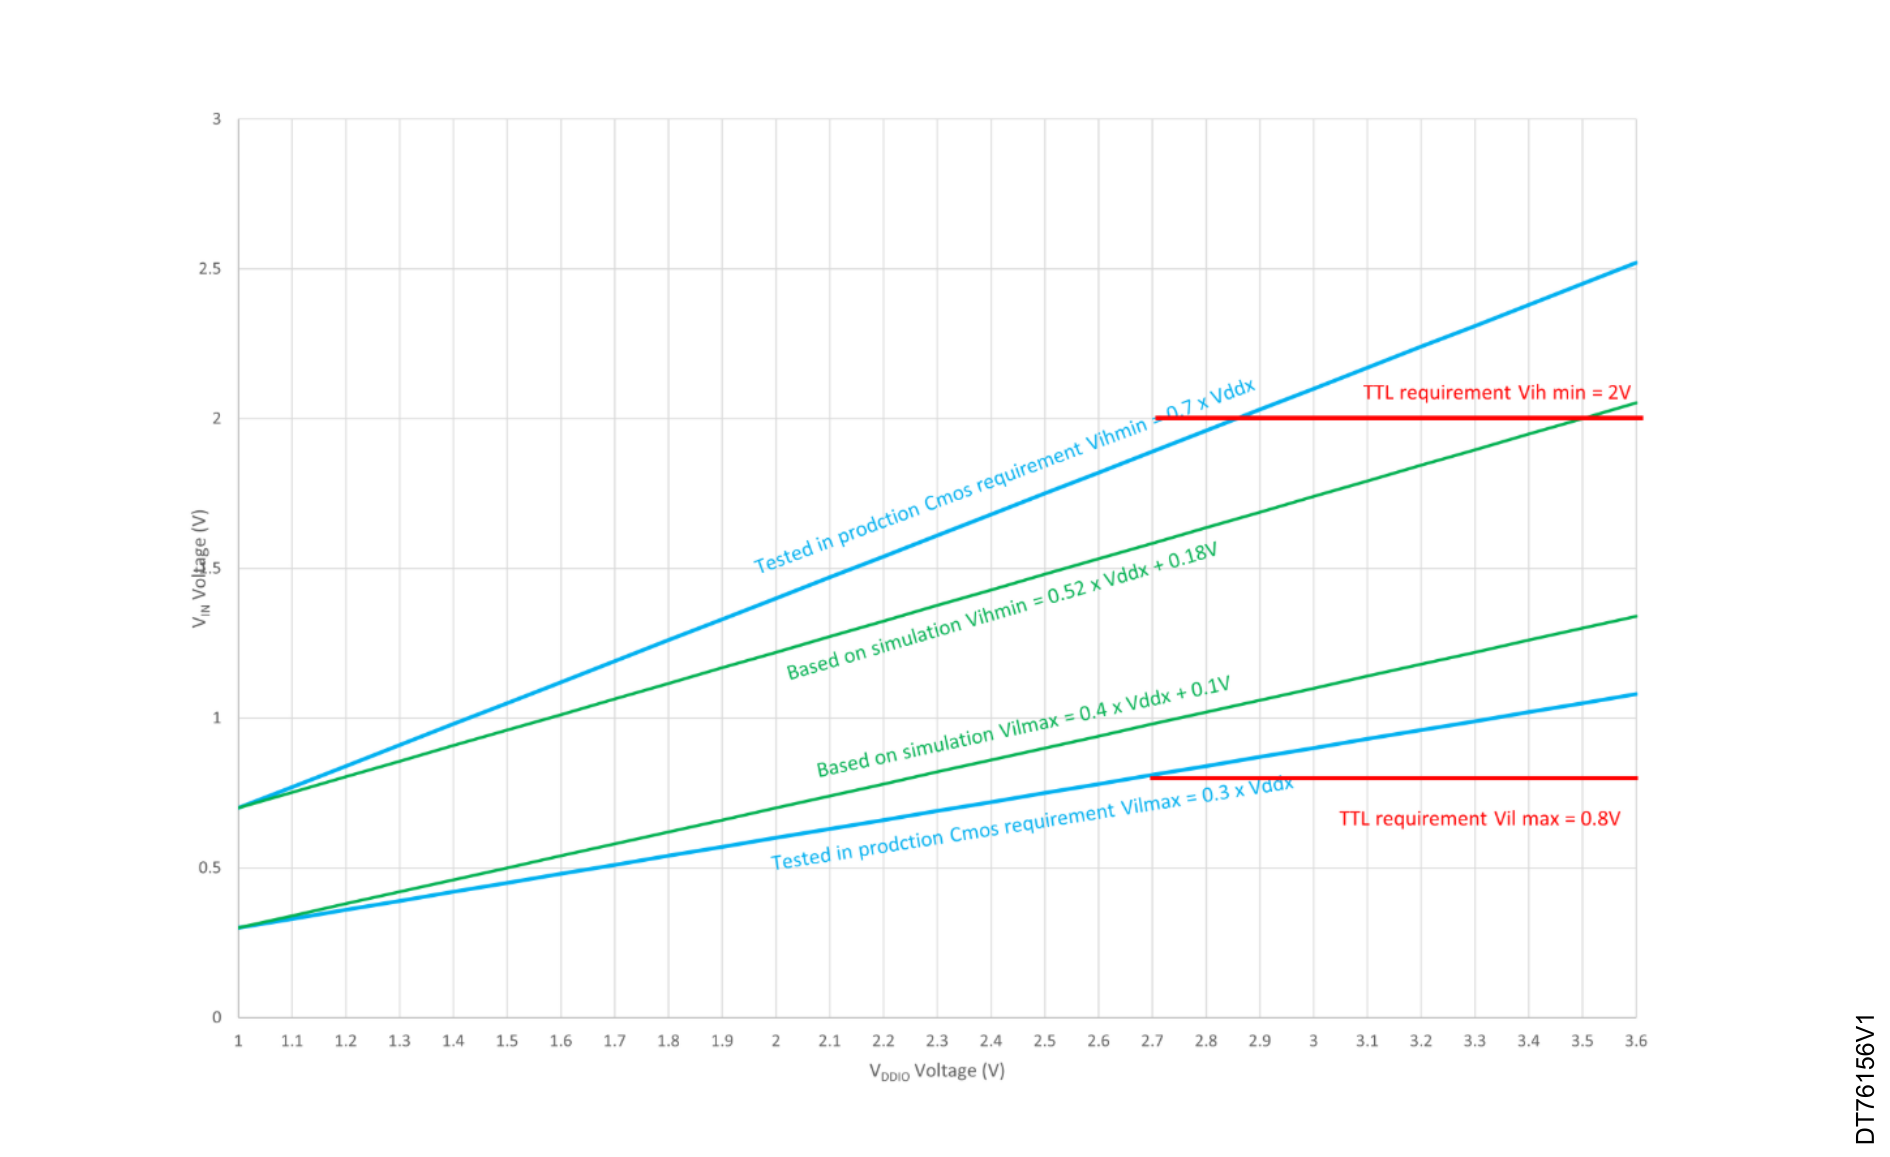
All I/Os are CMOS- and TTL-compliant (no software configuration required). Their characteristics cover more than the strict CMOS-technology or TTL parameters. The coverage of these requirements is shown in the following figure.
Output driving current
The GPIOs (except PC14, PC15) can sink or source up to ± 8 mA, and sink or source up to ± 20 mA (with a relaxed VOL/VOH). PC14, PC15 are limited in source capability: +3 mA shared between the I/Os.
In the user application, the number of I/O pins tat can drive current must be limited to respect the absolute maximum rating specified in Absolute maximum ratings:
- The sum of the currents sourced by all the I/Os on VDDIOx, plus the maximum consumption of the MCU sourced on VDD, cannot exceed the absolute maximum rating ∑IVDD (see Table 15 Current characteristics).
- The sum of the currents sunk by all the I/Os on VSS, plus the maximum consumption of the MCU sunk on VSS, cannot exceed the absolute maximum rating ∑IVSS (see Table 15 Current characteristics).
Output voltage levels
Unless otherwise specified, the parameters given in the table below are derived from tests performed under the ambient temperature and supply voltage conditions summarized in Table 17 General operating conditions. All I/Os are CMOS- and TTL-compliant (FT or TT unless otherwise specified).
| Symbol | Parameter | Conditions(9) | Min | Max | Unit |
|---|---|---|---|---|---|
| VOL | Output low-level voltage | CMOS port(8), |IIO| = 8 mA, 2.7 V ≤ VDD ≤ 3.6 V | - | 0.4 | V |
| VOH | Output high-level voltage | CMOS port(8), |IIO| = -8 mA, 2.7 V ≤ VDD ≤ 3.6 V | VDD - 0.4 | - | |
| VOL(9) | Output low-level voltage |
TTL port(8),|IIO| = 8 mA, 2.7 V ≤ VDD ≤ 3.6 V | - | 0.4 | |
| VOH(9) | Output high-level voltage |
TTL port(8),|IIO| = -8 mA, 2.7 V ≤ VDD ≤ 3.6 V | 2.4 | - | |
| VOL(9) | Output low-level voltage |
|IIO| = 20 mA, 2.7 V ≤ VDD≤ 3.6 V | - | 1.3 | |
| VOH(9) | Output high-level voltage |
|IIO| = -20 mA, 2.7 V ≤ VDD≤ 3.6 V | VDD - 1.3 | - | |
| VOLFM+(9) | Output low-level voltage for a FT_f I/O pin in FM+ mode |
|IIO| = 20 mA, 2.7 V ≤ VDD ≤ 3.6 V | - | 0.4 |
| Symbol | Parameter | Conditions(3) | Min | Max | Unit |
|---|---|---|---|---|---|
| VOL | Output low level voltage | CMOS port(10) IIO=0.5 mA 2.7 V≤ VDD ≤3.6 V | - | 0.4 | V |
| VOH | Output high level voltage | CMOS port(10) IIO=-0.5 mA 2.7 V≤ VDD ≤3.6 V | VDD - 0.4 | - | |
| VOL(11) | Output low level voltage | TTL port(10) IIO = 0.5 mA 2.7 V ≤ VDD ≤3.6 V | - | 0.4 | |
| VOH(11) | Output high level voltage | TTL port(10) IIO = -0.5 mA 2.7 V ≤ VDD ≤ 3.6 V | 2.4 | - |
Output AC characteristics
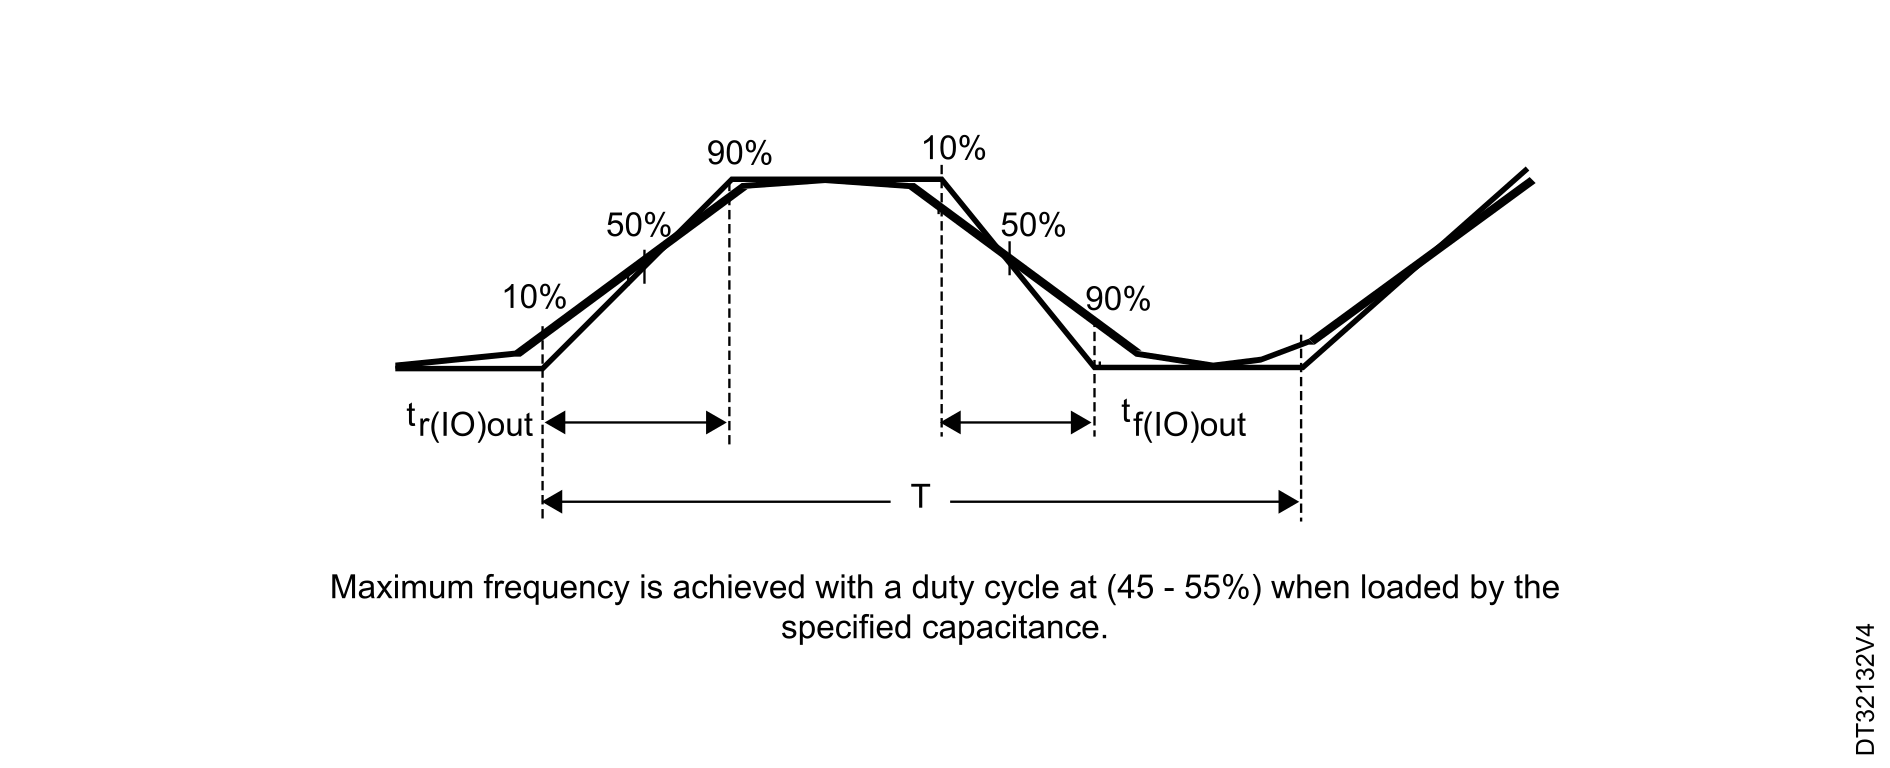
The definition and values of output AC characteristics are given in Figure 21 Output AC characteristics definition and in the table below respectively.
Unless otherwise specified, the parameters given are derived from tests performed under the ambient temperature and supply voltage conditions summarized in Table 17 General operating conditions.
| Speed | Symbol | Parameter | conditions | Min | Max | Unit |
|---|---|---|---|---|---|---|
| 00 | Fmax(12) | Maximum frequency | C = 50 pF, 2.7 V ≤ VDD ≤ 3.6 V | - | 4 | MHz |
| C = 30 pF, 2.7 V ≤ VDD ≤ 3.6 V | - | 4 | ||||
| C = 10 pF, 2.7 V≤ VDD ≤ 3.6 V | - | 4 | ||||
| tr/tf (13) | Output high to low level fall time and output low to high level rise time | C = 50 pF, 2.7 V≤ VDD ≤ 3.6 V | - | 51 | ns | |
| C = 30 pF, 2.7 V ≤ VDD ≤ 3.6 V | - | 46 | ||||
| C = 10 pF, 2.7 V ≤ VDD ≤ 3.6 V | - | 40 | ||||
| 01 | Fmax(12) | Maximum frequency | C = 50 pF, 2.7 V≤ VDD ≤ 3.6 V | - | 12 | MHz |
| C = 30 pF, 2.7 V≤ VDD ≤ 3.6 V | - | 12 | ||||
| C = 10 pF, 2.7 V ≤ VDD ≤ 3.6 V | - | 12 | ||||
| tr/tf(13) | Output high to low level fall time and output low to high level rise time | C = 50 pF, 2.7 V ≤ VDD ≤ 3.6 V | - | 19 | ns | |
| C = 30 pF, 2.7 V≤ VDD ≤ 3.6 V | - | 17 | ||||
| C = 10 pF, 2.7 V ≤ VDD ≤3.6 V | - | 14 | ||||
| 10 | Fmax(12)(14) | Maximum frequency | C = 50 pF, 2.7 V≤ VDD ≤ 3.6 V | - | 45 | MHz |
| C = 30 pF, 2.7 V ≤ VDD ≤ 3.6 V | - | 50 | ||||
| C = 10 pF, 2.7 V ≤ VDD ≤ 3.6 V | - | 55 | ||||
| tr/tf(13)(14) | Output high to low level fall time and output low to high level rise time | C = 50 pF, 2.7 V ≤ VDD ≤ 3.6 V | - | 7 | ns | |
| C = 30 pF, 2.7 V≤ VDD ≤ 3.6 V | - | 6 | ||||
| C = 10 pF, 2.7 V ≤ VDD ≤ 3.6 V | - | 4 | ||||
| 11 | Fmax(12)(14) | Maximum frequency | C = 50 pF, 2.7 V ≤ VDD ≤ 3.6 V | - | 90 | MHz |
| C = 30 pF, 2.7 V ≤ VDD ≤ 3.6 V | - | 96 | ||||
| C = 10 pF, 2.7 V ≤ VDD ≤ 3.6 V | - | 110 | ||||
| tr/tf(13)(14) | Output high to low level fall time and output low to high level rise time | C = 50 pF, 2.7 V ≤ VDD ≤ 3.6 V | - | 5 | ns | |
| C = 30 pF, 2.7 V ≤ VDD ≤ 3.6 V | - | 4 | ||||
| C = 10 pF, 2.7 V ≤ VDD ≤ 3.6 V | - | 3 |
1 Compliant with CMOS requirements.
2 Specified by design - Not tested in production.
3 This parameter represents the pad leakage of the I/O itself. The total product pad leakage is provided by the following formula: ITotal_Ileak_max = 10 μA + [number of I/Os where VIN is applied on the pad] × Ilkg max.
4 Max(VDDXXX) is the maximum value of all the I/O supplies.
5 To sustain a voltage higher than the minimum of VDD or VDDA plus 0.3 V, disable the internal pull-up and pull-down resistors.
6 VIN must be less than Max(VDDXXX) + 3.6 V.
7 The pull-up and pull-down resistors are designed with a true resistance in series with a switchable PMOS/NMOS. This PMOS/NMOS contribution to the series resistance is minimal (~10% order).
8 TTL and CMOS outputs are compatible with JEDEC standards JESD36 and JESD52.
9 Specified by design - Not tested in production.
10 TTL and CMOS outputs are compatible with JEDEC standards JESD36 and JESD52.
11 Specified by design - Not tested in production.
12 The maximum frequency is defined with the following conditions: (tr+tf) ≤ 2/3 T
13 The fall and rise times are defined between 90% and 10% and between 10% and 90% of the output waveform, respectively.
14 Compensation system enabled.
NRST pin characteristics
The NRST pin input driver uses the CMOS technology. It is connected to a permanent pullup resistor, RPU.
Unless otherwise specified, the parameters given in the table below are derived from tests performed under the ambient temperature and supply voltage conditions summarized in Table 17 General operating conditions.
| Symbol | Parameter | Conditions | Min | Typ | Max | Unit |
|---|---|---|---|---|---|---|
| VIL(NRST) | NRST input low-level voltage | - | - | - | 0.3 x VDDIOx | V |
| VIH(NRST) | NRST input high-level voltage | - | 0.7 x VDDIOx | - | - | |
| Vhys(NRST) | NRST Schmitt trigger voltage hysteresis | - | - | 200 | - | mV |
| RPU | Weak pull-up equivalent resistor(1) | VIN = VSS | 30 | 40 | 50 | kΩ |
| tF(NRST) | NRST input filtered pulse | - | - | - | 50 | ns |
| tNF(NRST) | NRST input not-filtered pulse | 2.7 V ≤ VDD ≤ 3.6 V | 350 | - | - |

(1): The reset network protects the device against parasitic resets.
(2): The user must ensure that the level on the NRST pin can go below the VIL(NRST) max level specified in the above table. Otherwise the reset is not taken into account by the device.
(3): The external capacitor on NRST must be placed as close as possible to the device.
1 The pull-up is designed with a true resistance in series with a switchable PMOS. This PMOS contribution to the series resistance is minimal (~10 % order).
Extended interrupt and event controller input (EXTI) characteristics
The pulse on the interrupt input must have a minimal length in order to guarantee that it is detected by the event controller.
| Symbol | Parameter | Conditions | Min | Typ | Max | Unit |
|---|---|---|---|---|---|---|
| PLEC | Pulse length to event controller | - | 20 | - | - | ns |
12-bit analog-to-digital converter ADC characteristics
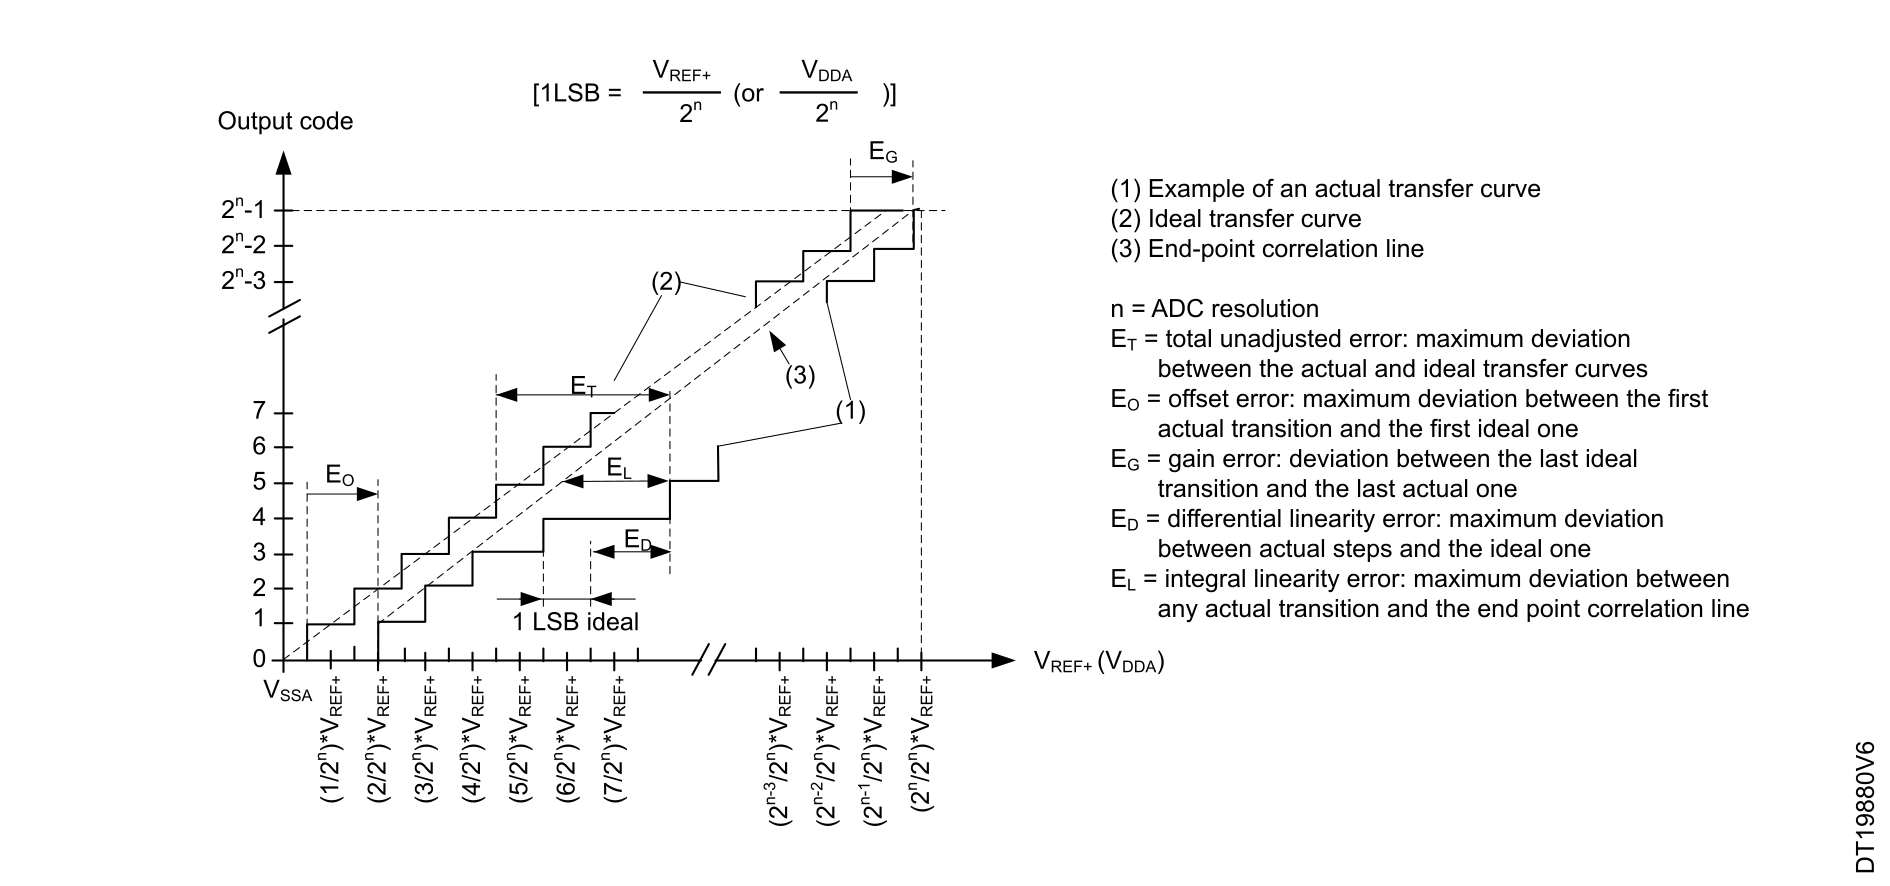
Unless otherwise specified, the parameters given in Table 53 12-bit ADC characteristics are values derived from tests performed under ambient temperature, fHCLK frequency, and VDDA supply voltage conditions summarized in Table 17 General operating conditions.
Note:
It is recommended to perform a calibration after each power-up.
| Symbol | Parameter | Conditions | Min | Typ | Max | Unit | |||||
|---|---|---|---|---|---|---|---|---|---|---|---|
| VDDA | Analog power supply for ADC ON | - | 2.70 | - | 3.6 | V | |||||
| VREF+ | Positive reference voltage | - | 2.5 | - | VDDA | ||||||
| VREF- | Negative reference voltage | - | VSSA | ||||||||
| fADC | ADC clock frequency | 2.7V ≤ VDDA ≤ 3.6 V | 8 | - | 36 | MHz | |||||
| fS with RAIN=47 Ω and CPCB = 22 pF | Sampling rate for slow channels | Resolution = 12 bits | All modes | 2.7 V ≤ V DDA ≤ 3.6 V | -40°C ≤ TJ ≤ 140°C | fADC= 36 MHz | SMP = 2.5 | - | 2.25 | - | MSPS |
| Resolution = 10 bits | - | 2.57 | - | ||||||||
| Resolution = 8 bits | - | 3 | - | ||||||||
| Resolution = 6 bits | - | 4.5 | - | ||||||||
| tTRIG | External trigger period | Resolution = 12 bits | 16 | - | - | 1/fADC | |||||
| VAIN | Conversion voltage range | - | 0 | - | VREF+ | V | |||||
| RAIN(1) | External input impedance | Resolution = 12 bits, TJ = 140°C | - | - | 110 | Ω | |||||
| Resolution = 12 bits, TJ = 125°C | - | - | 610 | ||||||||
| Resolution = 10 bits, TJ = 140°C | - | - | 2305 | ||||||||
| Resolution = 10 bits, TJ = 125°C | - | - | 4290 | ||||||||
| Resolution = 8 bits, TJ = 140°C | - | - | 11110 | ||||||||
| Resolution = 8 bits, TJ = 125°C | - | - | 15860 | ||||||||
| Resolution = 6 bits, TJ = 140°C | - | - | 46890 | ||||||||
| Resolution = 6 bits, TJ = 125°C | - | - | 79000 | ||||||||
| CADC | Internal sample and hold capacitor | - | - | 3 | - | pF | |||||
| tADCVREG_ STUP | ADC LDO startup time | - | - | - | 10 | µs | |||||
| tSTAB | ADC power-up time | LDO already started | 1 | - | - | conversion cycle | |||||
| tOFF_CAL | Offset calibration time | - | 85 | 1/fADC | |||||||
| tLATR | Trigger conversion latency for regular and injected channels | Trigger from an asynchronous clock | 3 | - | 4 | ||||||
| Trigger from a synchronous clock | 3 | ||||||||||
| tS | Sampling time | - | 2.5 | - | 288.5 | ||||||
| tCONV | Total conversion time (including sampling time) | N-bits resolution | tS + 1.5 + N | ||||||||
| IDDA(ADC) | ADC consumption on VDD, VDDA and VREF | fS = 2.25 MSPS | - | 200 | - | µA | |||||
| Symbol | Parameter | Min | Typ | Max | Unit |
|---|---|---|---|---|---|
| ET | Total unadjusted error | - | 4 | 5.7 | LSB |
| EO | Offset error | - | ±2.5 | ±5 | |
| EG | Gain error | - | 2.6 | 6 | |
| ED | Differential linearity error | -1 | - | 1.3 | |
| EL | Integral linearity error | -3 | ±2.5 | 3 | |
| ENOB | Effective number of bits | - | 10.7 | - | bits |
| SINAD | Signal-to-noise and distortion ratio | - | 66 | - | |
| SNR | Signal-to-noise ratio | - | 68 | - | dB |
| THD | Total harmonic distortion | - | -70 | - |


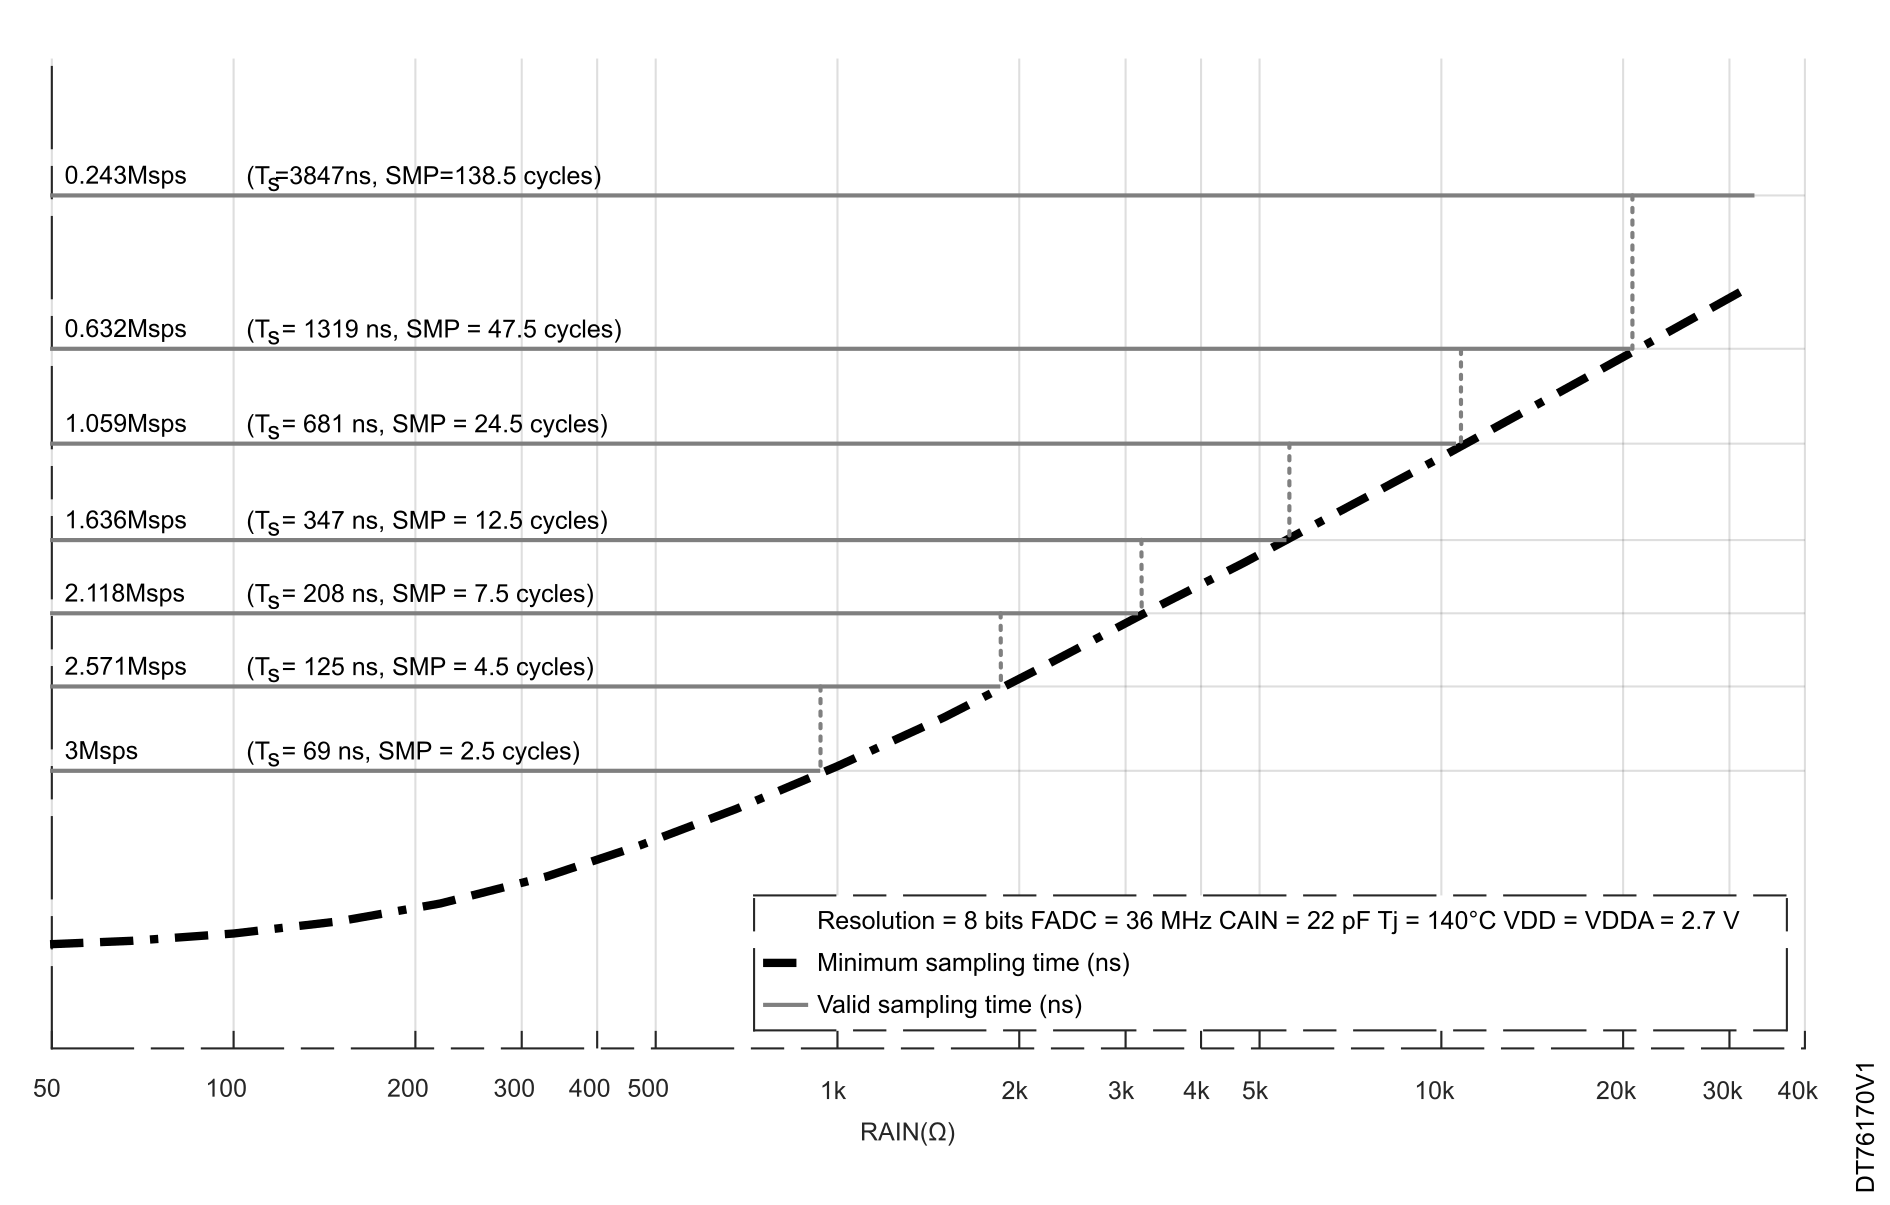

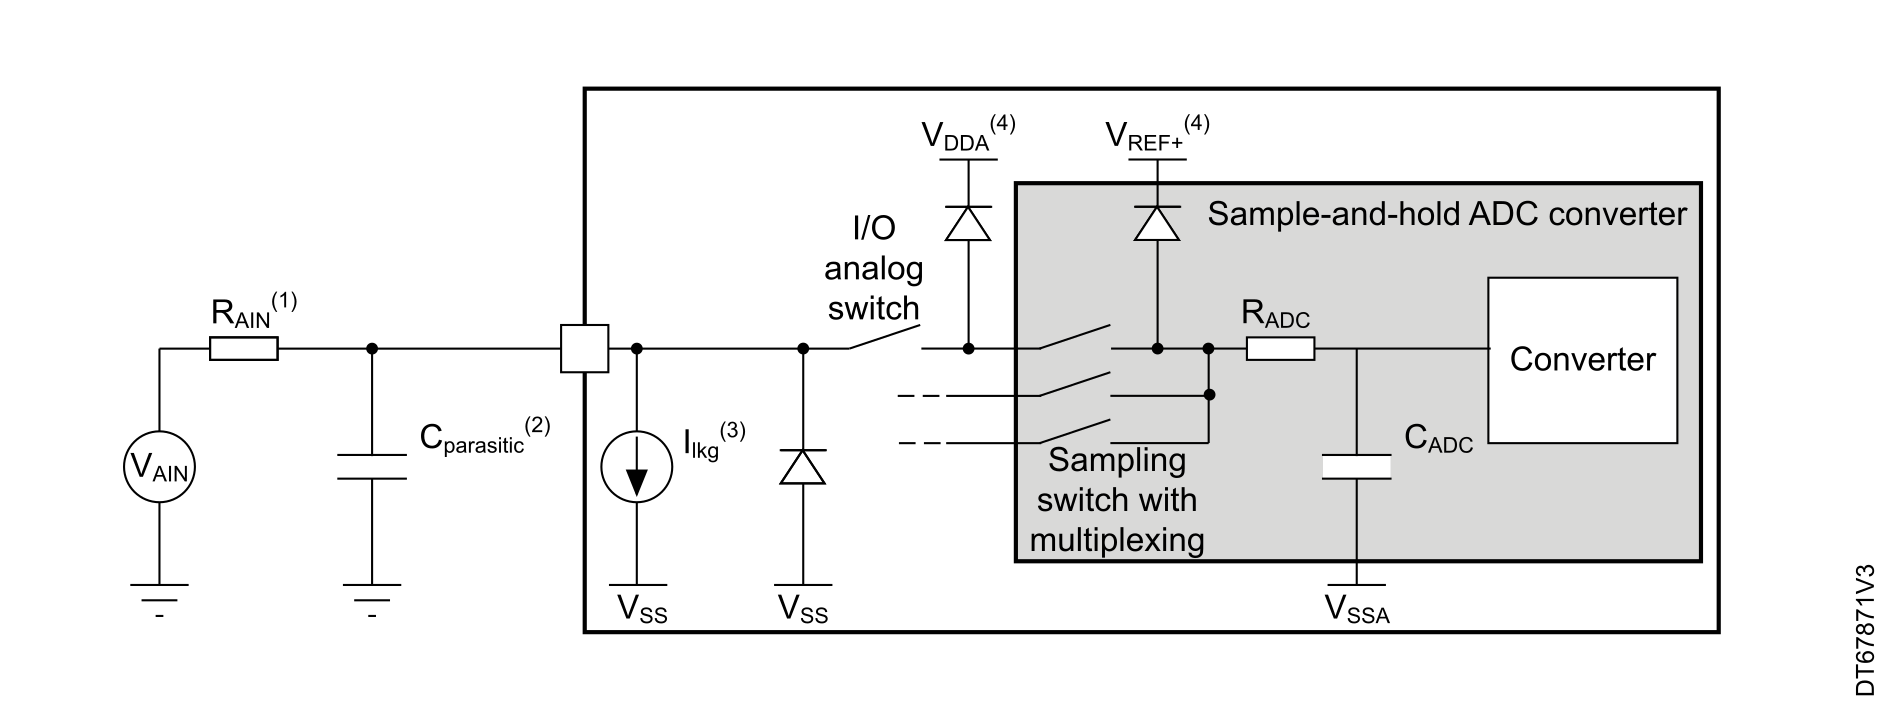
(1): Refer to the ADCx characteristic table for the values of RAIN and CADC.
(2): Cparasitic represents the capacitance of the PCB (dependent on soldering and PCB layout quality) plus the pad capacitance (refer to I/O port characteristics for the value of the pad capacitance). A high Cparasitic value downgrades the conversion accuracy. To remedy this, fADC must be reduced.
(3): Refer to I/O port characteristics for the values of Ilkg.
(4): Refer to Power supply scheme.
General PCB design guidelines
The power-supply decoupling must be performed as shown in the corresponding power‑supply scheme. The 100 nF capacitor must be ceramic (good quality) and must be placed as close as possible to the chip.
1 High temperature generate leakage current on ADC inputs. This current create voltage drop through Rain directly affecting ADC accuracy (worst case when VAIN = VDDA). To limit this effect to a tolerance of 2LSBs, you must respect Rain max tables.
Temperature sensor characteristics
| Symbol | Parameter | Min | Typ | Max | Unit |
|---|---|---|---|---|---|
| TL(1) | VSENSE linearity with temperature (from Vsensor voltage) | - | - | 3 | °C |
| Avg_Slope(2) | Average slope (from Vsense voltage) | - | 2.14 | - | mV/°C |
| V30(3) | Voltage at 30° C (± 1 ° C) | - | 0.65 | - | V |
|
tstart_run(1) | Startup time in Run mode (buffer startup) | - | - | 25.2 | µs |
| tS_temp(1) | ADC sampling time when reading the temperature | 13 | - | - | |
| Isens(1) | Sensor consumption | - | 0.18 | 0.29 | µA |
| Isensbuf(1) | Sensor buffer consumption | - | 3.8 | 6.5 |
| Symbol | Parameter | Memory address | |
|---|---|---|---|
| TS_CAL1 | Temperature sensor raw data acquired value at 30 °C, VDDA = 3.3 V | 0x08FF F814 - 0x08FF F815 | |
| TS_CAL2 | Temperature sensor raw data acquired value at 140 °C, VDDA = 3.3 V | 0x08FF F818 - 0x08FF F819 | |
1 Specified by design - Not tested in production.
2 Evaluated by characterization - Not tested in production.
3 Measured at VDDA = 3.3 V ± 10 mV. The V30 ADC conversion result is stored in the TS_CAL1.
Digital-to-analog converter characteristics (DAC)
| Symbol | Parameter | Conditions | Min | Typ | Max | Unit | |
|---|---|---|---|---|---|---|---|
| VDDA | Analog supply voltage | - | 2.7 | - | V | ||
| VREF+ | Positive reference voltage | - | 2.5 | - | VDDA | ||
| VREF- | Negative reference voltage | - | - | VSSA | - | ||
| RL | Resistive Load | DAC output buffer ON | connected to VSSA | 5 | - | - | KΩ |
| connected to VDDA | 25 | - | - | ||||
| RO | Output Impedance | DAC output buffer OFF | 10.3 | 13.00 | 16 | ||
| RBON | Output impedance sample and hold mode, output buffer ON | DAC output buffer ON | VDD = 2.7 V | - | - | 1.6 | KΩ |
| RBOFF | Output impedance sample and hold mode, output buffer OFF | DAC output buffer OFF | VDD = 2.7 V | - | - | 17.8 | KΩ |
| CL | Capacitive Load | DAC output buffer OFF | - | - | 50 | pF | |
| CSH | Sample and Hold mode | 0.10 | 1 | µF | |||
| VDAC_OUT | Voltage on DAC_OUT output | DAC output buffer ON | 0.2 | - | VDDA −0.2 | V | |
| DAC output buffer OFF | 0 | - | VREF+ | ||||
| tSETTLING | Settling time (full scale: for a 12-bit code transition between the lowest and the highest input codes when DAC_OUT reaches the final value of ±0.5LSB, ±1LSB, ±2LSB, ±4LSB, ±8LSB) | Normal mode DAC output buffer ON CL ≤ 50 pF, RL ≥ 5 kW | ±0.5 LSB | - | 1.7 | 3 | µs |
| ±1 LSB | - | 1.66 | 2.87 | ||||
| ±2 LSB | - | 1.65 | 2.84 | ||||
| ±4 LSB | - | 1.63 | 2.78 | ||||
| ±8 LSB | - | 1.61 | 2.7 | ||||
| Normal mode, DAC output buffer OFF, ±1 LSB CL = 10 pF | - | 1.7 | 2 | ||||
| tWAKEUP | Wakeup time from off state (setting the Enx bit in the DAC Control register) until the ±1LSB final value | Normal mode, DAC output buffer ON, CL ≤ 50 pF, RL = 5 Ω | - | 5 | 7.5 | µs | |
| Normal mode, DAC output buffer OFF, CL ≤ 10 pF | - | 2 | 5.0 | ||||
| PSRR | DC VDDA supply rejection ratio | Normal mode DAC output buffer ON CL ≤ 50 pF, RL = 5 kW | - | -80 | -28 | dB | |
| tSAMP | Sampling time in Sample and Hold mode CSH=100nF (Code transition between the lowest input code and the highest input code when DACOUT reaches final value +/- 1LSB) | MODE<2:0>_V12 = 100/101 (BUFFER ON) | - | 0.7 | 2.6 | ms | |
| MODE<2:0>_V12 = 110 (BUFFER OFF) | - | 11.5 | 18.7 | ||||
| MODE<2:0>_V12=111 BUFFER OFF (DAC_OUT pin not connected, internal connection only) | - | 0.3 | 0.6 | µs | |||
| Ileak | Output leakage current | - | - | - | - | nA | |
| CIint | Internal sample and hold capacitor | - | 1.43 | 1.75 | 2 | pF | |
| tTRIM | Middle code offset trim time | DAC output buffer ON | 50 | - | - | µs | |
| Voffset | Middle code offset for 1 trim code step | VREF+ = 3.6 V | - | 850 | - | µV | |
| IDDA(DAC) | DAC quiescent consumption from VDDA | DAC output buffer ON | No load, middle code (0x800) | - | 315 | - | µA |
| No load, worst code (0xF1C) | - | 450 | - | ||||
| DAC output buffer OFF | No load, middle/worst code (0x800) | - | 20 | - | |||
| Sample and Hold mode, CSH=100 nF | - | 315*Ton/(Ton+Toff) | - | ||||
| IDDV(DAC) | DAC consumption from VREF+ | DAC output buffer ON | No load, middle code (0x800) | - | 185 | - | |
| No load, worst code (0xF1C) | - | 185 | - | ||||
| DAC output buffer OFF | No load, middle/worst code (0x800) | - | 155 | - | |||
| Sample and Hold mode, Buffer ON, CSH=100 nF (worst code) | - | 185*Ton/(Ton+Toff) | - | ||||
| Sample and Hold mode, Buffer OFF, CSH=100 nF (worst code) | - | 155*Ton/(Ton+Toff) | - | ||||

| Symbol | Parameter | Conditions | Min | Typ | Max | Unit | |
|---|---|---|---|---|---|---|---|
| DNL | Differential non linearity(1) | DAC output buffer ON | -2 | - | 2 | LSB | |
| DAC output buffer OFF | -2 | - | 2 | ||||
| Monotonicity | 10 bits | - | - | - | - | ||
| INL | Integral non linearity(2) | DAC output buffer ON, CL ≤ 50 pF, RL ≥ 5 Ω | -4 | - | 4 | LSB | |
| DAC output buffer OFF, CL ≤ 50 pF, no RL | -4 | - | 4 | ||||
| Offset | Offset error at code 0x800 (2) | DAC output buffer ON, CL ≤ 50 pF, RL ≥ 5 Ω | VREF+ = 3.6 V | - | - | ±12 | LSB |
| DAC output buffer OFF, CL ≤ 50 pF, no RL | - | - | ±8 | ||||
| Offset1 | Offset error at code 0x001(3) | DAC output buffer OFF, CL ≤ 50 pF, no RL | - | - | ±5 | LSB | |
| OffsetCal | Offset error at code 0x800 after factory calibration | DAC output buffer ON, CL ≤ 50 pF, RL ≥ 5 Ω | VREF+ = 3.6 V | - | - | ±5 | LSB |
| Gain | Gain error(4) | DAC output buffer ON,CL ≤ 50 pF, RL ≥ 5 Ω | - | - | ±1 | % | |
| DAC output buffer OFF, CL ≤ 50 pF, no RL | - | - | ±1 | ||||
| TUE | Total unadjusted error | DAC output buffer ON CL≤ 50 pF, RL ≥ 5 kΩ | - | - | ±30 | LSB | |
| DAC output buffer OFF CL≤ 50pF, no RL | - | - | ±12 | ||||
| TUECal | Total unadjusted error after calibration | DAC output buffer ON CL≤ 50pF, RL>=5kΩ | - | - | ±23 | LSB | |
| SNR | Signal-to-noise ratio(5) | DAC output buffer ON CL ≤ 50 pF, RL ≥ 5 kΩ 1 kHz, BW 500KHz | - | 67.8 | - | dB | |
| DAC output buffer OFF CL≤ 50pF, no RL 1 kHz, BW 500 KHz | - | 67.8 | - | ||||
| THD | Total harmonic distortion(5) | DAC output buffer ON CL ≤ 50 pF, RL ≥ 5 kΩ, 1 kHz | - | -78,6 | - | dB | |
| DAC output buffer OFF CL ≤ 50 pF, no RL, 1 kHz | - | -78,6 | - | ||||
| SINAD | Signal-to-noise and distortion ratio(5) | DAC output buffer ON CL ≤ 50 pF, RL ≥ 5 kΩ, 1 kHz | - | 67.5 | - | dB | |
| DAC output buffer OFF CL≤ 50 pF, no RL, 1 kHz | - | 67.5 | - | ||||
| ENOB | Effective number of bits | DAC output buffer ON CL ≤ 50 pF, RL ≥ 5 kΩ, 1 kHz | - | 10.9 | - | bits | |
| DAC output buffer OFF CL≤ 50 pF, no RL, 1 kHz | - | 10.9 | - | ||||
1 Difference between two consecutive codes minus 1 LSB.
2 Difference between the value measured at Code i and the value measured at Code i on a line drawn between Code 0 and last Code 4095.
3 Difference between the value measured at Code (0x001) and the ideal value.
4 Difference between the ideal slope of the transfer function and the measured slope computed from code 0x000 and 0xFFF when the buffer is OFF, and from code giving 0.2 V and (VREF+ - 0.2 V) when the buffer is ON.
5 The signal is -0.5 dBFS with Fsampling=1 MHz.
Comparator characteristics
| Symbol | Parameter | Conditions | Min | Typ | Max | Unit | |
|---|---|---|---|---|---|---|---|
| VDDA | Analog supply voltage | - | 2.70 | - | 3.60 | V | |
| VIN | Comparator input voltage range | - | 0 | - | VDDA | ||
| VBG | Scaler input voltage | - | (1) | ||||
| VSC | Scaler offset voltage | - | - | ±5 | ±10 | mV | |
| IDDA(SCALER) | Scaler static consumption from VDDA | BRG_EN=0 (bridge disable) | - | 0.2 | 0.3 | µA | |
| BRG_EN=1 (bridge enable) | - | 0.82 | 1 | ||||
| tSTART_SCALER | Scaler startup time | - | - | 140 | 250 | µs | |
| tSTART | Comparator startup time to reach propagation delay specification | High-speed mode | - | 2 | 5 | µs | |
| Medium mode | - | 5 | 20 | ||||
| tD(2) | Propagation delay for 200 mV step with 100 mV overdrive | High-speed mode | - | 50 | 80 | ns | |
| Medium mode | - | 0.5 | 0.9 | µs | |||
| Propagation delay for step > 200 mV with 100 mV overdrive only on positive inputs | High-speed mode | - | 50 | 120 | ns | ||
| Medium mode | - | 0.5 | 1.2 | µs | |||
| Voffset | Comparator offset error | Full common mode range | - | - | ±20 | mV | |
| Vhys | Comparator hysteresis | No hysteresis | - | 0 | - | mV | |
| Low hysteresis | - | 10 | - | ||||
| Medium hysteresis | - | 20 | - | ||||
| High hysteresis | - | 30 | - | ||||
| IDDA(COMP) | Comparator consumption from VDDA | Medium mode | Static | - | 5 | 9 | µA |
| With 50 kHz ±100 mV overdrive square signal | - | 6 | - | ||||
| High-speed mode | Static | - | 70 | 110 | |||
| With 50 kHz ±100 mV overdrive square signal | - | 75 | - | ||||
1 Refer to Embedded voltage reference.
2 Evaluated by characterization - Not tested in production.
Timer characteristics
The parameters given in #id_68761__IDTBL00-15066, Table 61 IWDG min/max timeout period at 32 kHz (LSI), and #id_68761__IDTBL00-15173 are specified by design, not tested in production.
Refer to Table 47 I/O static characteristics for details on the input/output alternate function characteristics (output compare, input capture, external clock, PWM output).
| Symbol | Parameter | Conditions | Min | Max | Unit(1) |
|---|---|---|---|---|---|
| tres(TIM) | Timer resolution time | - | 1 | - | tTIMxCLK |
| fTIMxCLK = 144 MHz | 6.9 | - | ns | ||
| fEXT | Timer external clock frequency on CH1 to CH4 | - | 0 | fTIMxCLK/2 | MHz |
| fTIMxCLK = 144 MHz | 0 | 72 | |||
| ResTIM | Timer resolution | TIMx (except TIM2/TIM5) | - | 16 | bit |
| TIM2/TIM5 | - | 32 | |||
| tCOUNTER | 16-bit counter clock period | - | 1 | 65536 | tTIMxCLK |
| fTIMxCLK = 144 MHz | 0.007 | 455.1 | µs | ||
| tMAX_COUNT | Maximum possible count with 32‑bit counter | - | - | 4, 294, 967, 296 | tTIMxCLK |
| fTIMxCLK = 144 MHz | - | 29.826 | s |
| Prescaler divider | PR[2:0] bits | Min timeout RL[11:0] = 0x000 | Max timeout RL[11:0] = 0xFFF | Unit |
|---|---|---|---|---|
| /4 | 0 | 0.125 | 512 | ms |
| /8 | 1 | 0.250 | 1024 | |
| /16 | 2 | 0.500 | 2048 | |
| /32 | 3 | 1.0 | 4096 | |
| /64 | 4 | 2.0 | 8192 | |
| /128 | 5 | 4.0 | 16384 | |
| /256 | 6 or 7 | 8.0 | 32768 |
| Prescaler | WDGTB | Min timeout values | Max timeout value | Unit |
|---|---|---|---|---|
| 1 | 0 | 0.0284 | 1.820 | ms |
| 2 | 1 | 0.0569 | 3.641 | |
| 4 | 2 | 0.1138 | 7.282 | |
| 8 | 3 | 0.2276 | 14.564 | |
| 16 | 4 | 0.4551 | 29.127 | |
| 32 | 5 | 0.9102 | 58.254 | |
| 64 | 6 | 1.820 | 116.508 | |
| 128 | 7 | 3.641 | 233.017 |
1 TIMx, is used as a general term in which x stands for 1, 2, 5, 6, 7, 8, 12, 15, 16, 17.
I3C interface characteristics
The I3C interface meets the timing requirements of the MIPI® I3C specification v1.1.
The I3C peripheral supports:
- I3C SDR-only as controller
- I3C SDR-only as target
- I3C SCL bus clock frequency up to 12.5 MHz
The parameters given in Table 63 Open drain timing measurements below are obtained with the following configuration:
- Output speed is set to OSPEEDRy[1:0] = 10
- I/O Compensation cell activated
- Voltage scaling range 1
The I3C timings are in line with the MIPI specification, except for the ones given in Table 63 Open drain timing measurements, I3C open-drain measured timing. For tSU_OD, this can be mitigated by increasing the corresponding SCL low duration in the I3C_TIMINGR0 register. For further details refer to AN5879.
| Symbol | Parameter | Conditions | Min | Unit |
|---|---|---|---|---|
| tSU_OD | SDA data setup time in open drain mode |
Controller 2.7 V ≤ VDDIOX ≤ 3.6 V | 22(1) | ns |
1 The minimum SDA data setup time during open-drain-mode is 3 ns, as specified in the MIPI Alliance specification for I3C.
I²C interface characteristics
The I²C interface meets the timing requirements of the I2C-bus specification and user manual rev. 03 for:
- Standard mode (Sm): Bit rate up to 100 kbit/s.
- Fast mode (Fm): Bit rate up to 400 kbit/s.
- Fast mode plus (Fm+): Bit rate up to 1 Mbit/s.
The I²C timing requirements are specified by design, not tested in production, when the I²C peripheral is properly configured (refer to the product reference manual).
The SDA and SCL I/O requirements are met with the following restrictions:
- The SDA and SCL I/O pins are not true open-drain. When configured as open-drain, the PMOS connected between the I/O pin and VDDIOx is disabled but remains present.
- Only FT_f I/O pins support Fm+ low level output current maximum requirement. Refer to I/O port characteristics for the I²C I/Os characteristics.
Al I²C SDA and SCL I/Os embed an analog filter. Refer to the table below for the analog filter characteristics.
1 Spikes with widths below tAF(min) are filtered.
2 Spikes with widths above tAF(max) are not filtered.
USART characteristics
Unless otherwise specified, the parameters given in Table 65 USART (SPI mode) characteristics are derived from tests performed under the ambient temperature, fPCLKx frequency and VDD supply voltage conditions summarized in not found, with the following configuration:
- Output speed set to OSPEEDRy[1:0] = 10
- Capacitive load CL = 30 pF
- Measurement points done at 0.5 × VDD level
- I/O compensation cell activated
Refer to I/O port characteristics for more details on the input/output alternate function characteristics (NSS, CK, TX, RX for USART).
| Symbol | Parameter | Conditions | Min | Typ | Max | Unit | |
|---|---|---|---|---|---|---|---|
| fCK | USART clock frequency |
Master transmitter mode, 2.7 V ≤ VDD ≤ 3.6 V | - | - | 18 | ||
|
Slave receiver mode, 2.7 V ≤ VDD ≤ 3.6 V | - | - | 48 | ||||
|
Slave transmitter mode, 2.7 V ≤ VDD ≤ 3.6 V | - | - | 27 | ||||
| tsu(NSS) | NSS setup time | Slave mode | tker(1) + 2 | - | - | ns | |
| th(NSS) | NSS hold time | Slave mode | 2 | - | - | ||
| tw(CKH) | CK high and low time | Master mode | 1/ fCK /2-1 | 1/ fCK /2 | 1/ fCK /2+1 | ||
| tw(CKL) | |||||||
| tsu(RX) | Data input setup time | Master mode | 18 | - | - | ||
| tsu(RX) | Slave mode | 2.5 | - | - | |||
| th(RX) | Data input hold time | Master mode | 0.5 | - | - | ||
| th(RX) | Slave mode | 1 | - | - | |||
| tv(TX) | Data output valid time | Slave mode | 2.7 V ≤ VDD ≤ 3.6 V | - | 13.5 | 18 | |
| Master mode | 2.7 V ≤ VDD ≤ 3.6 V | - | 2 | 2.5 | |||
| th(TX) | Data output hold time | Slave mode | 9 | - | - | ||
| th(TX) | Data output hold time | Master mode | 0.5 | - | - | ||

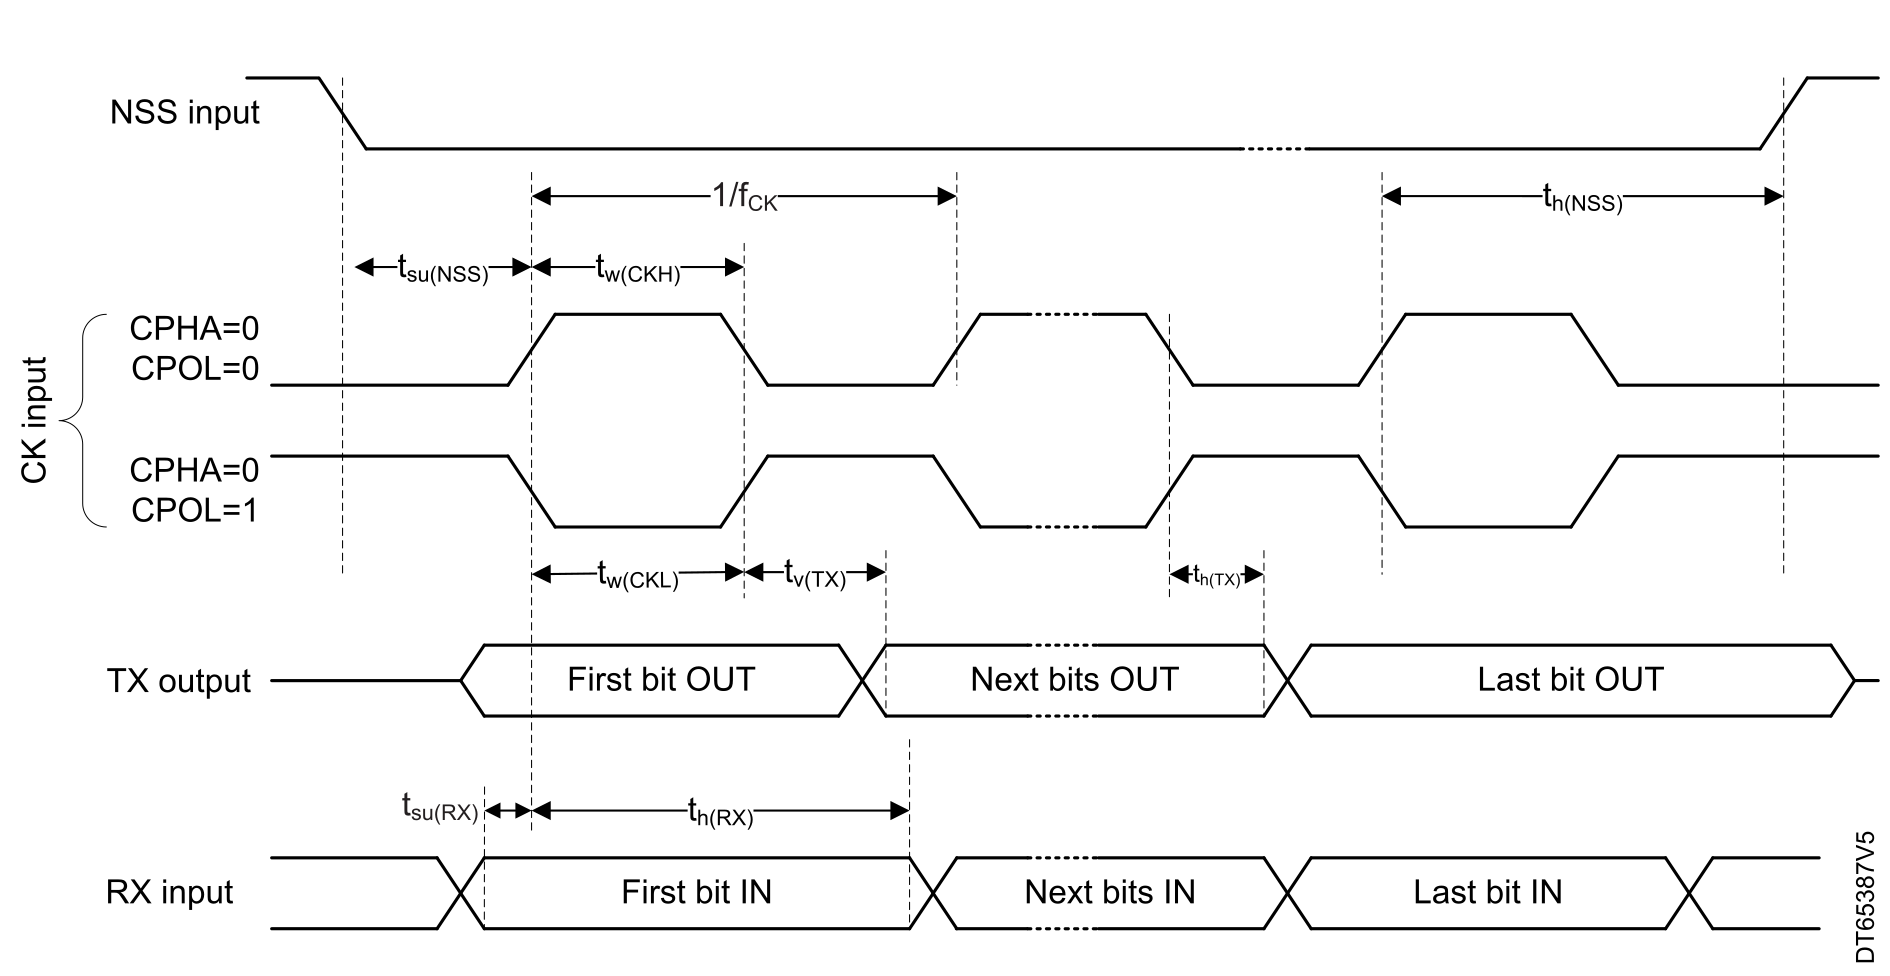
1 Tker is the usart_ker_ck_pres clock period.
SPI characteristics
Unless otherwise specified, the parameters given in Table 66 SPI characteristics are derived from tests performed under the ambient temperature, fPCLKx frequency and supply voltage conditions summarized in Table 17 General operating conditions.
- Output speed set to OSPEEDRy[1:0] = 11
- Capacitive load CL = 30 pF
- Measurement points done at 0.5 × VDD level
- I/O compensation cell activated
Refer to Table 47 I/O static characteristics for more details on the input/output alternate function characteristics (NSS, SCK, MOSI, MISO for SPI).
| Symbol | Parameter | Conditions | Min | Typ | Max | Unit | |
|---|---|---|---|---|---|---|---|
| fSCK | SPI clock frequency | Master mode | - | - | 72 | MHz | |
| Slave receiver mode | 100 | ||||||
| Slave mode transmitter/full duplex | 32 | ||||||
| tsu(NSS) | NSS setup time | Slave mode | 3 | - | - | ns | |
| th(NSS) | NSS hold time | 1 | - | - | |||
| tw(SCKH), tw(SCKL) | SCK high and low time | Master mode | TPLCK - 1 | TPLCK | TPLCK + 1 | ||
| tsu(MI) | Data input setup time | Master mode | DDRS = 0 | 2.5 | |||
| DDRS = 1 | 10-TSCK/2 | - | - | ||||
| tsu(SI) | Slave mode | 2 | - | - | |||
| th(MI) | Data input hold time | Master mode | DDRS = 0 | 1 | - | - | |
| DDRS = 1 | (TSCK/2)-7 | - | - | ||||
| th(SI) | Slave mode | 1.5 | - | - | |||
| ta(SO) | Data output access time | Slave mode | 12 | 13.5 | 15.5 | ||
| tdis(SO) | Data output disable time | Slave mode | 6.5 | 8.5 | 10.5 | ||
| tv(SO) | Data output valid time | Slave mode | - | 12 | 15.5 | ||
| Master mode | - | 2 | 2.5 | ||||
| th(SO) | Data output hold time | Slave mode, | 8 | - | - | ||
| th(MO) | Master mode | 0 | - | - | |||
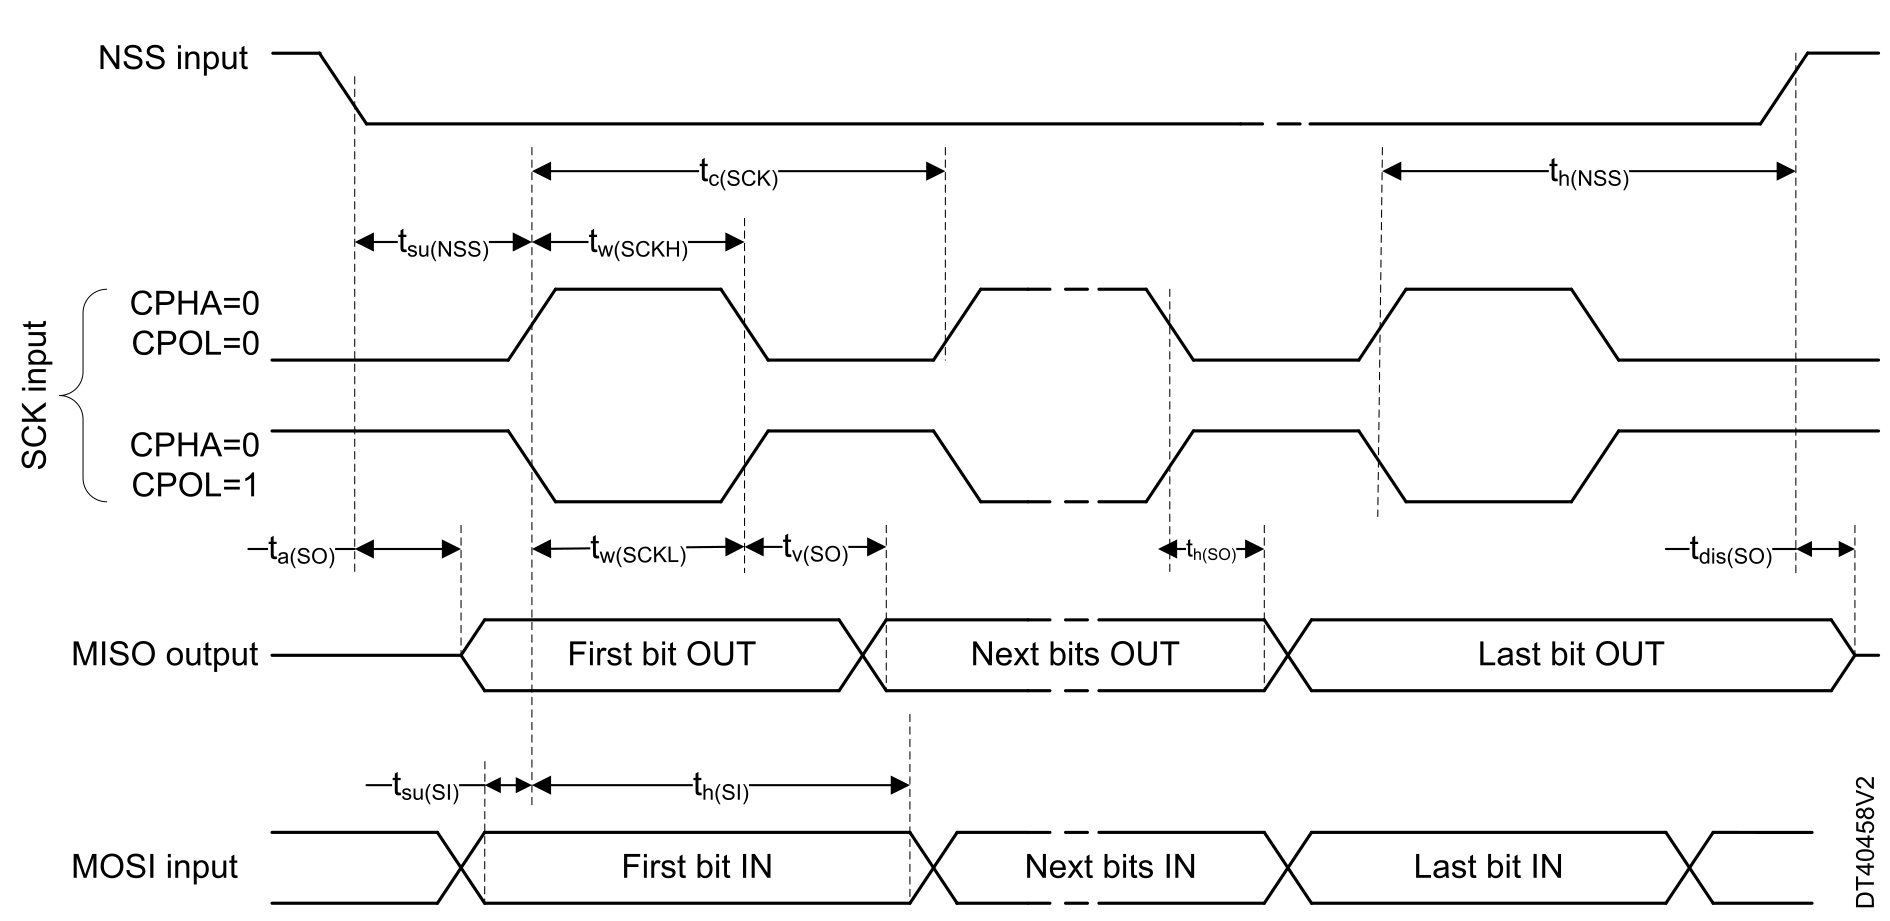

Note:
Measurement points are done at 0.3 VDD and 0.7 VDD levels.

Note:
Measurement points are done at 0.3 VDD and 0.7 VDD levels.
I2S interface characteristics
Unless otherwise specified, the parameters given in Table xx for I2S are derived from tests performed under the ambient temperature, fPCLKx frequency and VDD supply voltage conditions summarized in Table 67 I2S characteristics, with the following configuration:
- Output speed is set to OSPEEDRy[1:0] = 10
- Capacitive load C = 30 pF
- Measurement points are done at CMOS levels: 0.5 × VDD
- IO Compensation cell activated
Refer to I/O port characteristics: I/O port characteristics for more details on the input/output alternate function characteristics (CK, SDO, SDI, WS).
| Symbol | Parameter | Conditions | Min | Max | Unit |
|---|---|---|---|---|---|
| fMCK | I2S main clock output | - | - | 50 | MHz |
| fCK | I2S clock frequency | Master Tx or RX, slave Rx | - | 50 | MHz |
| Slave Tx | - | 19 | |||
| tv(WS) | WS valid time | Master mode | - | 3 | ns |
| th(WS) | WS hold time | Master mode | 1 | - | |
| tsu(WS) | WS setup time | Slave mode | 2 | - | |
| th(WS) | WS hold time | Slave mode | 0.5 | - | |
| tsu(SD_MR) | Data input setup time | Master receiver | 2.5 | - | ns |
| tsu(SD_SR) | Data input setup time | Slave receiver | 1 | - | |
| th(SD_MR) | Data input hold time | Master receiver | 1.5 | - | |
| th(SD_SR) | Slave receiver | 2.5 | - | ||
| tv(SD_ST) | Data output valid time | Slave transmitter (after enable edge) | - | 15.5 | |
| th(SD_ST) | Data output hold time | Slave transmitter (after enable edge) | 8 | - | |
| tv(SD_MT) | Data output valid time | Master transmitter (after enable edge) | - | 2 | |
| th(SD_MT) | Data output hold time | Master transmitter (after enable edge) | 0.5 | - |
USB_FS characteristics
1 USB functionality is ensured down to 2.7 V, but some USB electrical characteristics are degraded in 2.7 to 3.0 V range.
2 No external termination series resistors are required on USB_DP (D+) and USB_DM (D-). The matching impedance is already included in the embedded driver.
JTAG/SWD interface characteristics
Unless otherwise specified, the parameters given in Table 69 JTAG characteristics and Table 70 SWD characteristics are derived from tests performed under the ambient temperature, fHCLKx frequency and VDD supply voltage conditions summarized in Table 17 General operating conditions, with the following configuration:
- Output speed set to OSPEEDRy[1:0] = 10
- Capacitive load CL = 30 pF
- Measurement points done at 0.5 × VDD level
Refer to Table 47 I/O static characteristics for more details on the input/output characteristics.
| Symbol | Parameter | Min | Typ | Max | Unit |
|---|---|---|---|---|---|
| FTCK | TCK clock frequency | - | - | 34 | MHz |
| tisu(TMS) | TMS input setup time | 2 | - | - | ns |
| tih(TMS) | TMS input hold time | 0.5 | - | - | |
| tisu(TDI) | TDI input setup time | 1.5 | - | - | |
| tih(TDI) | TDI input hold time | 0.5 | - | - | |
| tov(TDO) | TDO output valid time | - | 11 | 14.5 | |
| toh(TDO) | TDO output hold time | 7.5 | - | - |
| Symbol | Parameter | Min | Typ | Max | Unit |
|---|---|---|---|---|---|
| FSWCLK | SWCLK clock frequency | - | - | 71 | MHz |
| tisu(SWDIO) | SWDIO input setup time | 3 | - | - | ns |
| tih(SWDIO) | SWDIO input hold time | 0.5 | - | - | |
| tov(SWDIO) | SWDIO output valid time | - | 11.5 | 14 | |
| toh(SWDIO) | SWDIO output hold time | 9.5 | - | - |